Question
1. The graph in the figure shows the difference between the global average temperature of the twentieth century and global monthly temperatures from 1985 to 2015. Answer the questions given below.
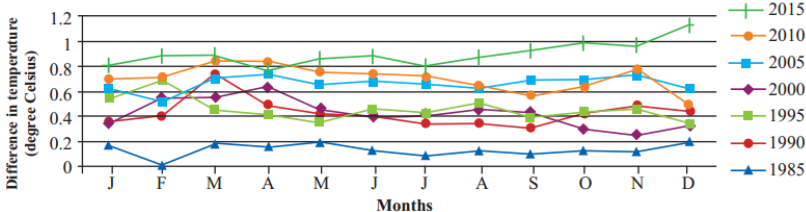
(1)In which year is the difference the least?
(2)What is the difference between the mean temperatures of the twentieth century and temperature in 2015?
(3)Why do the temperatures differ in different months?