Question
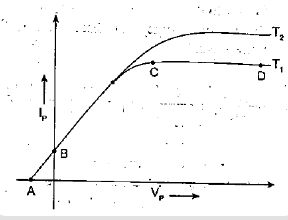
A graph of vacuum diode current $I_p,$ is plotted against the anode voltage $V_p$ for two different temperatures $T_{1}$ and $T_{2}$ of the cathode, as shown in the figure below. Study the graph and answer the following questions.
For the same anode voltage$, ($called plate voltage$),$ the current more when the cathode temperature changes from $T_1$ to $T_2$ higher temperature.
For the same anode voltage$, ($called plate voltage$),$ the current more when the cathode temperature changes from $T_1$ to $T_2$ higher temperature.