MCQ
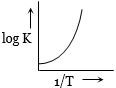
A graph plotted between $\log \,K$ vs $ 1/T$ for calculating activation energy is shown by
- A
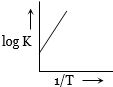
- ✓
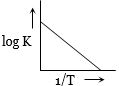
- C
- D
from Arrhenius equation
$\log \,k = \log \,A - \frac{{{E_A}}}{{2.303\,RT}}$
Generate a complete, print-ready paper with questions like this in minutes — across 16+ boards, with answer keys.