Question
(a) Write the conclusions drawn by Alexander von Humbolt based on his extensive exploration of South America.
(b) Study the graph given below :
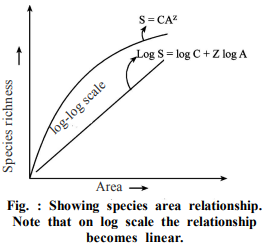
According to Alexander von Humbolt, what do the symbols S, A, C, and Z used in graphs indicate in the context of a species and region relationship?
(b) Study the graph given below :
According to Alexander von Humbolt, what do the symbols S, A, C, and Z used in graphs indicate in the context of a species and region relationship?