MCQ
Best method to increase the sensitivity of the moving coil galvanometer is to decrease:
- ARadius of the coil
- BNumber of turns of the coil
- CExternal magnetic field
- DCouple per unit twist
Explanation:
Sensitivity of a galvanometer increases when radius of the coil, number of turns of the coil and external magnetic field increases whereas couple per unit twist decreases.
Generate a complete, print-ready paper with questions like this in minutes — across 16+ boards, with answer keys.
Number of electrons in one coulomb of charge will be
|
(a) 5.46 |
(b) 6.25 |
(c) 1.6 |
(d) 9 |
In the arrangement of resistances shown below, the effective resistance between points A and B is

|
(a) 20 Ω |
(b) 30 Ω |
(c) 90 Ω |
(d) 110 Ω |
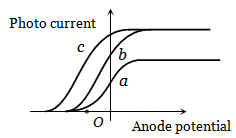
The figure shows the variation of photocurrent with anode potential for a photo-sensitive surface for three different radiations. Let ![]() and
and ![]() be the intensities and
be the intensities and ![]() and
and ![]() be the frequencies for the curves a, b and c respectively
be the frequencies for the curves a, b and c respectively
|
(a) |
(b) |
|
(c) |
(d) |
The kinetic energy of an electron which is accelerated through a potential of 100 volts is
|
(a) 1.602 |
(b) 418.6 calories |
(c) 1.16 |
(d) 6.626 |
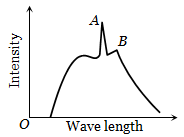
The figure represents the observed intensity of X-rays emitted by an X-ray tube as a function of wavelength. The sharp peaks A and B denote
|
(a) Band spectrum |
(b) Continuous spectrum |
|
(c) Characteristic radiations |
(d) White radiations |