Question
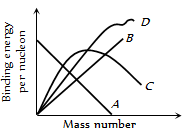
Binding energy per nucleon plot against the mass number for stable nuclei is shown in the figure. Which curve is correct
|
(a) A |
(b) B |
(c) C |
(d) D |