Question
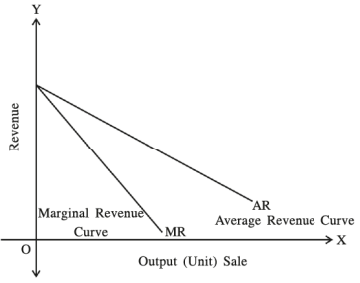
Clarify the relationship between average revenue and marginal revenue through schedule and figure.

Answer

 
  • Imperfect Competitive Market :-
    • In imperfect competitive market, monopoly. monopolistic competition and oligopoly etc. are included.
    • From this market, only in perfect monopoly the average revenue curve would be rectangular hyperbola and the marginal revenue is zero and that is why its curve is on $OX$ axis.
    • Generally, in these type of market particularly in monopoly and monopolistic competitive market firm has to reduce price to increase the sale.
    • So the total revenue is increase at diminishing rate with increase of sale. In this situation, demand curve (average revenue curve) is seen left to right from upward to downward slope.
    • In this market, firm has to decrease the price to increase the sale and that is why marginal revenue is also decrease.
    • Thus, in this market both average revenue and marginal revenue decrease.
    • So both curve (for average revenue & marginal revenue) has downward slope and both are different.
    • With increase in sale, both average revenue and marginal revenue decreases but the decreases in marginal revenue is faster than average revenue.
    • In short, in imperfect competitive market, the average revenue and marginal revenue curves have negative slopes but the marginal revenue curve is seen on the lower side than average revenue curve.
  • Explanation Through Schedule :
    • In imperfect competitive market, to increase the sale, price has to decreases and total sales revenue of units of production increase at diminishing rate.
    • And average revenue and marginal revenue both are decrease which can be seen through following schedule.
Unit of Production Total revenue
(TR) (Rs.)
Average Revenue
(AR) (Rs.)
Marginal Revenue
(MR) (Rs.)
$1$ $10$ $10$ $10$
$2$ $18$ $9$ $8$
$3$ $24$ $8$ $6$
$4$ $28$ $7$ $4$
$5$ $30$ $6$ $2$
$6$ $30$ $5$ $0$
$7$ $28$ $4$ $-2$
    • As per above schedule, when average revenue decrease, the marginal revenue also decrease.
    • But marginal revenue decrease faster than average revenue.
    • Because marginal rate of additional unit decreases.
    • But this price decreases are distributed between all remaining units and because of that, average revenue is decreases as slower rate.
    • When marginal revenue is zero then total sales revenue ($TR$) is maximum and fixed.
    • When marginal revenue becomes negative then total sales revenue decreases.
    • Average revenue never become zero and that is why average revenue curve never touch the horizontal axis.
  • Presentation through figure :
    • In imperfect competitive market, an individual firm has to reduce the price of commodity to increase the sale.
    • In this situation as per given figure average revenue and marginal revenue line seen from left to right side from upward to downward (negative slope ).
    • Because of decrease in price, average revenue and marginal revenue both are decrease. But the decrease in average revenue is slower than marginal revenue.
    • This concept is explained through following figure.
    • In the given figure on $OX$ axis production (sale) and on $OY$ axis revenue are given.
    • As $107$per figure, average revenue curve and marginal revenue curve is seen towards downward side from left side to right side.
    • Following conclusions are made for this context.
  • Total revenue of the firm is increase at diminishing rate because of increase in production. Price has to decrease to increase the sale.
  • In imperfect competitive market, firm has to reduce the price to increase the sale. So with increase in sale, marginal revenue is decreases.
  • In this market, firm has to decrease the price to increase the sale. This matter also affects the previous units.
  • Hence the disadvantage of decreases in price will be distributed amongst the all units and that's why average revenue decreases less than marginal revenue.
  • With increase in production, marginal revenue decrease faster than average revenue.
  • Average revenue curve seen upper side and marginal revenue curve seen lower side.
  • Monopoly, monopolistic competition, oligopoly etc. markets are included in imperfect competitive market.
  • In this market, average revenue curve and marginal revenue curve are seen with negative slope hence there is a difference in slope of both the curve.
  • In monopoly, average revenue curve and marginal revenue curve is with negative slope and inelastic and in monopolistic competitive market, it is seen with negative slope and elastic.
  • Marginal revenue can be zero but average revenue can't become zero.
  • So, marginal revenue curve can be touch the horizontal axis when average revenue curve never touch it.

Need a full question paper?

Generate a complete, print-ready paper with questions like this in minutes — across 16+ boards, with answer keys.

Start Generating Free