Question
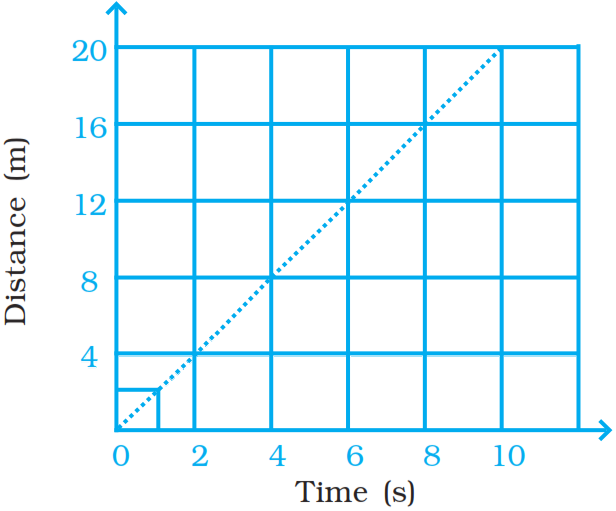
Complete the data of the table given below with the help of the distance-time graph given in Figure.
Distance (m)
$0$
$4$
$?$
$12$
$?$
$20$
Time (s)
$0$
$2$
$4$4
$?$
$8$
$10$

Answer

From the graph given above, it is a case of uniform motion, so
Distance (m)
$0$
$4$
$8$
$12$
$16$
$20$
Time (s)
$0$
$2$
$4$
$6$
$8$
$10$

Need a full question paper?

Generate a complete, print-ready paper with questions like this in minutes — across 16+ boards, with answer keys.

Start Generating Free