Question
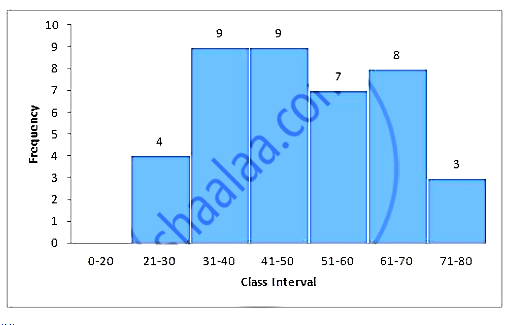
Construct a frequency distribution table for the numbers given below, using the class intervals
21 – 30, 31 – 40 ………… etc.
75, 65, 57, 26, 33,44, 58, 67, 75, 78, 43, 41, 31, 21, 32, 40, 62, 54, 69, 48, 47, 51, 38, 39, 43, 61, 63, 68, 53, 56, 49, 59, 37, 40, 68, 23, 28, 36 and 47.
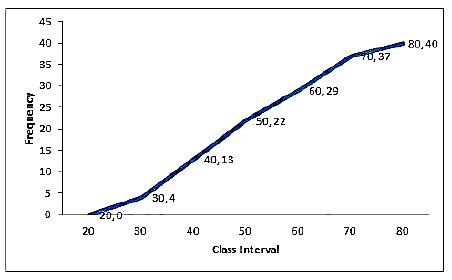
Use the table obtained to draw: (1) a histrogram (2) an ogive
21 – 30, 31 – 40 ………… etc.
75, 65, 57, 26, 33,44, 58, 67, 75, 78, 43, 41, 31, 21, 32, 40, 62, 54, 69, 48, 47, 51, 38, 39, 43, 61, 63, 68, 53, 56, 49, 59, 37, 40, 68, 23, 28, 36 and 47.
Use the table obtained to draw: (1) a histrogram (2) an ogive