Question
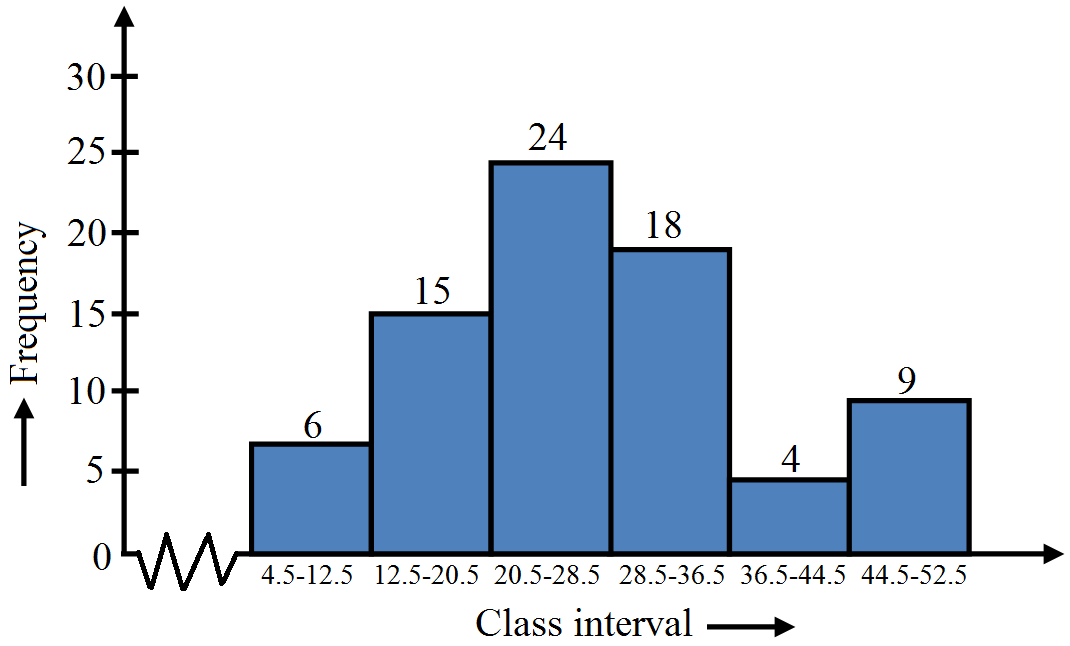
Construct a histogram for the following frequency distribution:
Class interval
$5-12$
$13-20$
$21-28$
$29-36$
$37-44$
$45-52$
Frequency
$6$
$15$
$24$
$18$
$4$
$9$

Answer

Histogram is the graphical representation of a frequency distrubution in the form of rectangles, such that there is no gap between any two successive rectangles. Clearly and the lower limit of the next class. Therefore, we need to convert the given frequency distribution into exclusive form, as shown below:
Class interval
$4.5-12.5$
$12.5-20.5$
$20.5-28.5$
$28.5-36.5$
$36.5-44.5$
$44.5-52.5$
Frequency
$6$
$15$
$24$
$18$
$4$
$9$
To draw the required histogram, take class intervals, along $x$-axis and frequencies along $y$-axis draw rectangles. So, we required histogram. Since the scale on $X$-axis starts at $4.5$, a kink (break) is indicated near the origin to show that graph is drawn to scale beginning at $4.5$.

Need a full question paper?

Generate a complete, print-ready paper with questions like this in minutes — across 16+ boards, with answer keys.

Start Generating Free

Similar questions

Given below is the bar graph indicating the marks obtained out of $50$ in mathematics paper by $100$ students. Read the bar graph and answer the following questions:

$i.$ It is decided to distribute workbooks on mathematics to the students obtaining less than $20$ marks, giving one workbook to each of such students.
 If a workbook costs $Rs. 5,$ what sum is required to buy the workbooks$?$
$ii.$ Every student belonging to the highest mark group is entitled to get a prize of $Rs. $
$10.$ How much amount of money is required for distributing the prize money$?$
$iii.$ Every student belonging to the lowest mark$-$group has to solve $5$ problems per day.
How many problems, in all, will be solved by the students of this group per day$?$
$iv.$ State whether true or false:
$a. 17\%$ students have obtained marks ranging from $40$ to $49.$
$b. 59$ students have obtained marks ranging from $10$ to $29.$
$v.$ What is the number of students getting less than $20$ marks$?$
$vi.$ What is the number of students getting more than $29$ marks$?$
$vii.$ What is the number of students getting marks between $9$ and $40?$
$viiii.$ What is the number of students belonging to the highest mark group$?$
$ix.$ What is the number of students obtaining more than $19$ marks$?$
Draw the graph of the equation $\frac{\text{x}}{3}+\frac{\text{y}}{4}=1.$ Also, find the area of the triangle formed by the line and the coordinates axes.
In the given figure, $AB \| CD \| EF , \angle D B G=x, \angle E D H=y, \angle A E B=z, \angle E A B=90^{\circ}$ and $\angle B E F=65^{\circ}$. Find the values of $x , y$ and $z$ .Image
In the adjoining figure, $BC$ is a diameter of a circle with centre $O.$ If $AB$ and $CD$ are two chords such that $AB || CD,$ prove that $AB = CD.$
In the given figure, $AB \| CD$ and $\angle A O C=x^{\circ}$. If $\angle O A B=104^{\circ}$ and $\angle O C D=116^{\circ}$, find the value of $x.$
Image
A rectangular lawn, $75\ m$ by $60\ m$, has two roads, each road 4m wide, running through the middle of the lawn, one parallel to length and the other parallel to breadth, as shown in the figure. Find the cost of gravelling the rosds at ₹ $50$ per $m^2.$​​​​​​​
Two lines $AB$ and $CD$ intersect at a point $O,$ such that $\angle\text{BOC}+\angle\text{AOD}=280^\circ,$ as shown in the figure. Find all the four angles.
Draw a histogram for the follwoing data:
Class intervals
$600-640$
$640-680$
$680-720$
$720-760$
$760-800$
$800-840$
Frequency
$18$
$45$
$153$
$288$
$171$
$63$
Using this histrogram, draw the frequency polygon on the same graph.
In each of the figures given below, $ABD$ is a rectangle. Find the values of $x$ and $y$ in each case.
Find the integral roots of the polynomial $f(x)=x^3+6 x^2+11 x+6$.