Question
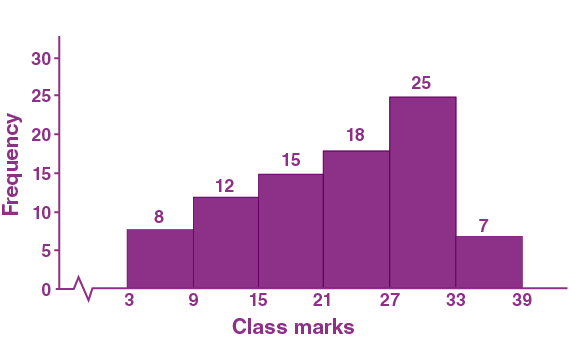
Construct histograms for following frequency distribution:
| Class Mark | 6 | 12 | 18 | 24 | 30 | 36 |
| Frequency | 8 | 12 | 15 | 18 | 25 | 7 |
| Class Mark | 6 | 12 | 18 | 24 | 30 | 36 |
| Frequency | 8 | 12 | 15 | 18 | 25 | 7 |
| Class Interval | Frequency |
| 3-9 | 8 |
| 9-15 | 12 |
| 15-21 | 15 |
| 21-27 | 18 |
| 27-33 | 25 |
| 33-39 | 7 |
Generate a complete, print-ready paper with questions like this in minutes — across 16+ boards, with answer keys.
| Marks (less than) | 10 | 20 | 30 | 40 | 50 | 60 | 70 | 80 |
| No. of students | 5 | 15 | 30 | 54 | 72 | 86 | 94 | 100 |