Question
Define an average and explain the essentials of a good average.
Generate a complete, print-ready paper with questions like this in minutes — across 16+ boards, with answer keys.
|
X
|
Frequency (f)
|
|
5
|
5
|
|
10
|
7
|
|
15
|
?
|
|
20
|
10
|
|
25
|
8
|
|
30
|
6
|
|
|
$\sum\text{f}=50$
|
| School | Mean Income (₹) | Standard Deviation |
| A | 800 | 120 |
| B | 900 | 135 |
|
District
|
1
|
2
|
3
|
4
|
5
|
6
|
7
|
8
|
9
|
10
|
|
Wheat
|
12
|
10
|
15
|
19
|
21
|
16
|
18
|
9
|
25
|
10
|
|
Rice
|
22
|
29
|
12
|
23
|
18
|
15
|
12
|
34
|
18
|
12
|
| Output (Units) | Marginal Revenue (₹) | Total Revenue (₹) | Average Revenue(₹) |
| 1 | 10 | - | - |
| 2 | 8 | - | - |
| 3 | 0 | - | - |
| 4 | -2 | - | - |
|
|
X-seires
|
Y-series
|
|
Mean
|
15
|
28
|
|
Sum of Squares of deviations from mean
|
144
|
225
|
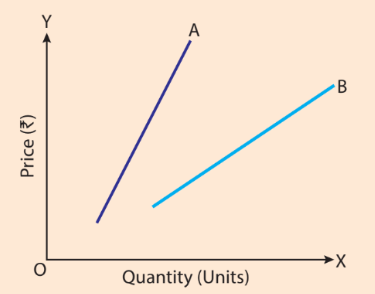
Complete the following table and also draw the market demand curve.
| Price (₹) | Quantity Demanded by Isha (Units) | Quantity Demanded by Misha (Units) | Market Demand (Units) |
| 10 | 3 | - | 8 |
| 9 | - | 8 | 15 |
| 8 | 11 | - | 22 |
| 7 | - | 14 | 30 |
| 6 | 20 | 22 | - |