Question
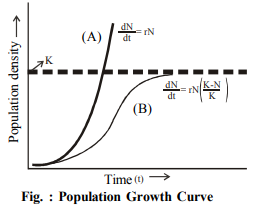
Describe the logistic population growth.

Answer

Logistic Growth : No population of any species in nature has at its disposal unlimited resources to permit exponential growth. This leads to competition between individuals for limiting resources. Eventually, the 'fittest' individual will survive and reproduce. A population growing in a habitat with limited resources show initially a lag phase, followed by phases of acceleration and deceleration and finally an asymptote, when the population density reaches the carrying capacity. A plot of N in relation to time (t) results in a sigmoid curve. This type of population growth is called Verhulst-Pearl Logistic Growth and is described by the following equation;
$dN / dt =\frac{ rN ( K - N )}{ K }$
Where, N = Population density at time t
r = Intrinsic rate of natural increase
K = Carrying capacity
Since resources for growth for most animal populations are finite and become limiting sooner or later, the logistic growth model is considered a more realistic one.
Image
(A) When responses are not limiting the growth, plot is exponential. 
(B) When responses are limiting the growth, plot is logistic, K is carrying capacity.

Need a full question paper?

Generate a complete, print-ready paper with questions like this in minutes — across 16+ boards, with answer keys.

Start Generating Free

Similar questions

Discuss the role of microbes as biofertilisers in detail.

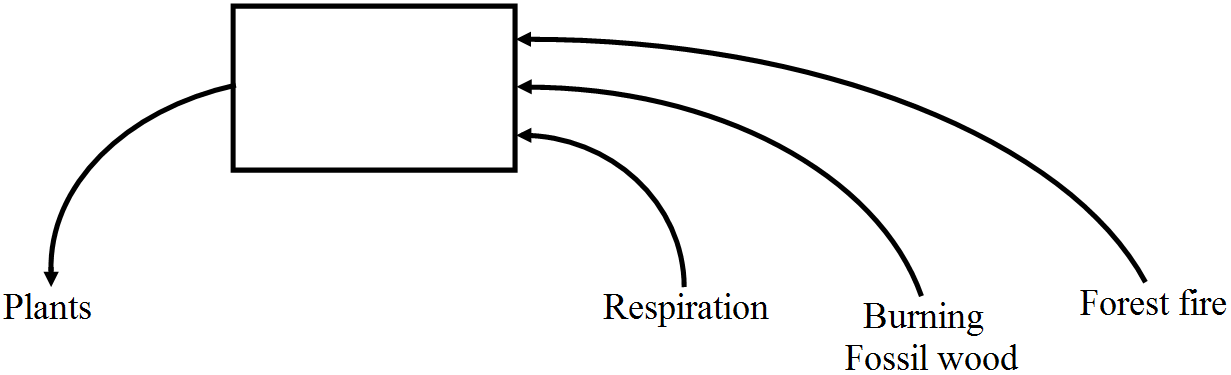
The above diagram shows a simplified biogeochemical cycle.

  1. Name the compound whose cycle is depicted.
  2. In what way do vehicles add this compound to atmosphere?
  3. What adverse effect does its excess have on the environment?
  4. Cite an event which depicts this effect in the modern times.
  5. Suggest two ways of reducing this effect.
A person in your colony has recently been diagnosed with AIDS. People/residents in the colony want him to leave the colony for the fear of spread of AIDS.
  1. Write your view on the situation, giving reasons.
  2. List the possible preventive measures that you would suggest to the residents of your locality in a meeting organised by you so that they understand the situation.
  3. Write the symptoms and the causative agent of AIDS.
Study the flow chart given below and answer the questions that follow:
  1. S strain into mice mice die.
  2. R strain into mice → mice live.
  3. Heat killed S strain + live R strain into mice → A
  4. Heat killed S strain + DNase + live R strain → into mice B
  1. Name the organism and differentiate between its two strains, R and S, respectively.
  2. Write the results A and B obtained in steps (e) and (d), respectively.
  3. Name the Scientist who performed the steps (a), (b) and (c).
  4. Write the specific conclusion drawn from the step (d).
What is the Human Genome Project? Write the features of the Human Genome Project. Give a diagram representing the Human Genome Project.
Draw a labelled schematic structure of a transcription unit. Explain the function of each component in the unit in the process of transcription.
Answer the following questions:
Draw a diagrammatic sectional view of a human seminiferous tubule, and label Sertoli cells, primary spermatocyte, spermatogonium and spermatozoa in it.
What is ecological succession? What is climax community? How is climax community established?
Observe the representation of genes involved in the lac operon given below:

  1. Identify the region where the repressor protein will attach normally.
  2. Under certain conditions repressor is unable to attach at this site. Explain.
  3. If repressor fails to attach to the said site what products will be formed by z, y and a?
  4. Analyse why this kind of regulation is called negative regulation.
Identify a, b and c in the table given below:
S. No.
Pattern of inheritance
Monohybrid F1 phenotypic expression
(i)
Co–dominance
a
(ii)
b
The progeny resembled only one of the parents.
(iii)
Incomplete dominance
c