Question
Direction Analyse the following case study graphs and answer questions (i) to (v) on the basis of the same.
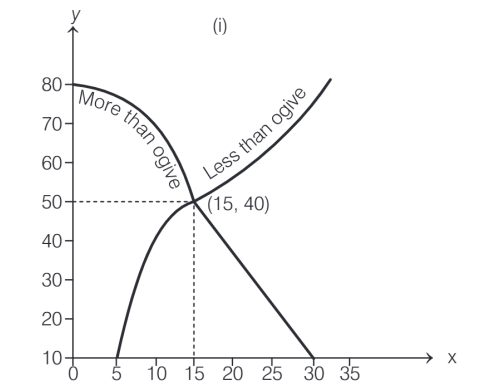
- According to figure one, value of median is equal to .........
- 15
- 20
- 30
- 40
- Median can be located graphically using which of the following?
- Less than ogive.
- More than ogive.
- Both less than ogive and more than ogive together.
- All of the above.
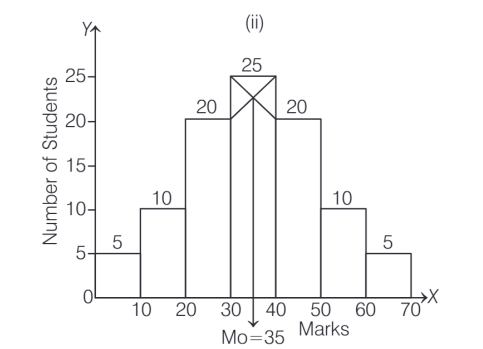
- Which form of graphical presentation is used to locate mode?
- Histogram
- Bar graphs
- Cumulative curves
- Arithmetic line graphs
- According to figure two, the approxi- mate value of mode is equal to .........
- 25
- 35
- 45
- Can't be determined
- What will be the mean value in case 1?
- 10
- 15
- 25
- None of the above