Question
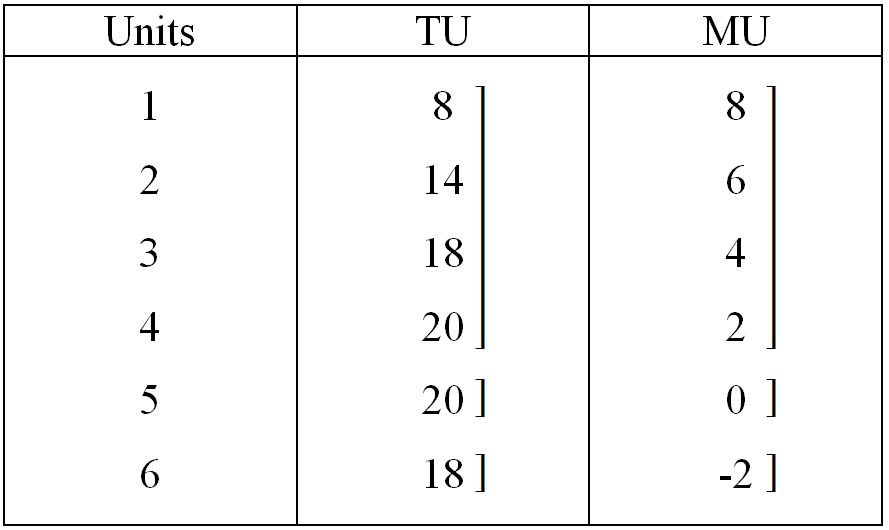
Discuss briefly, using a hypothetical schedule the relation between marginal utility and total utility.
OR
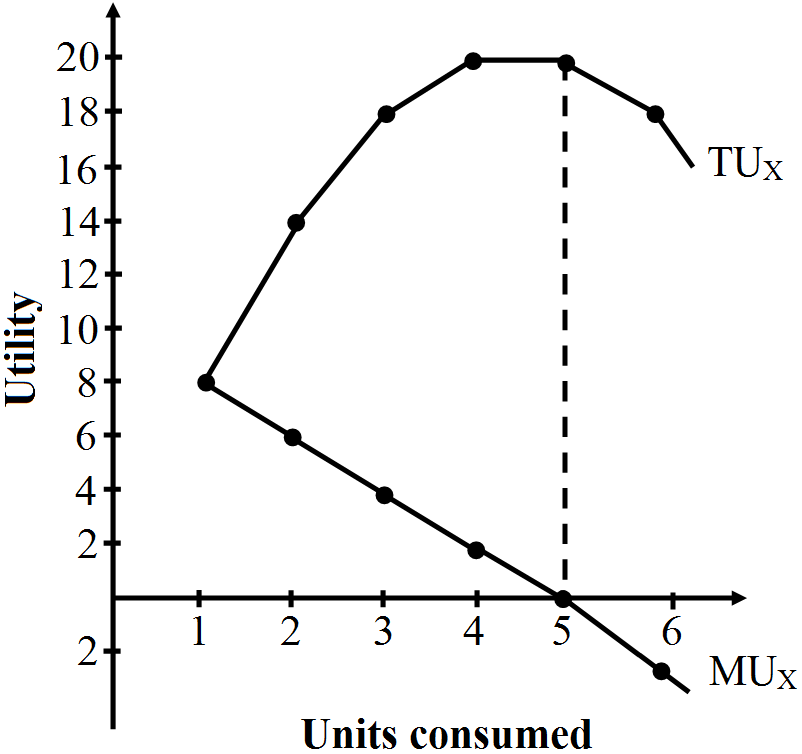
Explain the relationship between total utility and marginal utility with the help of a schedule and diagram.

OR
How does total utility change with the change in marginal utility of a commodity? Explain.
Show that total utility is maximum and constant when marginal utility is zero.

Answer

The relationship between MU and TU is as follows:
  1. When MU is positive, TU rises at diminishing rate.
  2. When MU is zero, TU is maximum and constant.
  3. When MU is negative, TU falls.
The following utility schedule and diagram illustrates the relationship:


On the basis of the schedule and diagram we infer:
  1. When MU is positive, TU will rise
  2. When MU is zero, TU is maximum and constant. (at unit 5).
  3. When MU is negative, TU falls (unit 6 onwards).

Need a full question paper?

Generate a complete, print-ready paper with questions like this in minutes — across 16+ boards, with answer keys.

Start Generating Free

Similar questions

Explain the effect of (a) change in own price and (b) change in price of substitute on demand of a good.
When price of a commodity falls by ₹ $1$ per unit, its quantity demanded rises by $3$ units. Its price elasticity of demand is $(-)2$. Calculate its quantity demanded if the price before the change was ₹ $10$ per unit.
Given the price of a good, how does a consumer decide as to how much of that good to buy.
Or
Explain the condition of determining how many units of a good consumer will buy at a given price.
OR
Explain why the price a consumer is willing to pay for a good equals the marginal utility of X when in equilibrium.
OR
Explain why consumer's equilibrium is attained when the utility of a product in terms of money is equal to its price.
A consumer spends continues to spend ₹ 1000 on a good priced at ₹ 8 per unit. When price rises by 25 percent, the consumer ₹ 1000 on the good. Calculate price elasticity of demand by percentage method.
Explain the conditions of consumer's equilibrium with the help of utility analysis.
Complete the following table:
Price (₹)
Output (units)
Total Revnue (₹)
Marginal Revenue (₹)
__
$1$
$6$
__
$4$
$2$
__
$2$
__
$3$
$6$
__
$1$
$4$
__
$-2$
Explain the distinction between change in demand and change in quantity demanded of a commodity.
OR
Explain the distinction between a shift in demand curve and a movement along the demand curve. Use diagram.
Distinguish between classification and tabulation of data.
Draw a production possibility curve. What does a point below this curve indicate? Explain.
What is monopolistic competition? Can a seller in such a market influence the price? Explain.