Question
Distinguish between change in quantity supplied and change in supply. Use diagram.
|
Basis
|
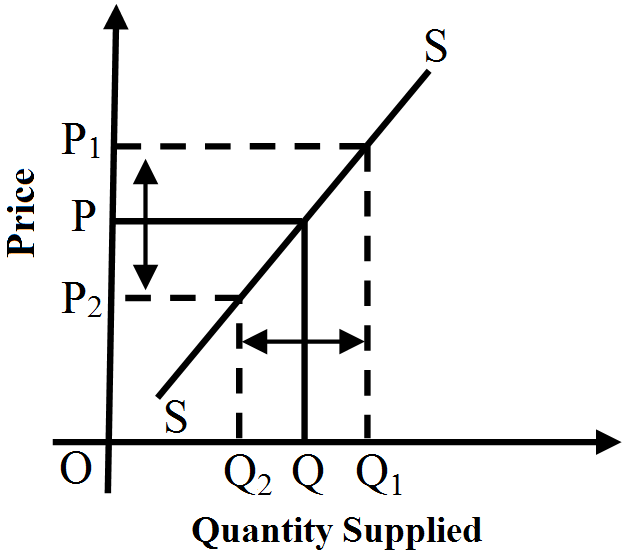
Changes in quantity supplied
|
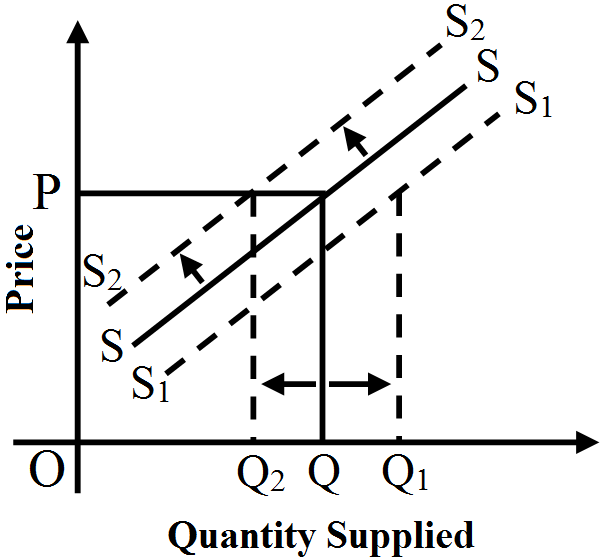
Change in supply
|
||||||||||||||||||||||||
|
Meaning
|
The change in quantity supplied due to the change in price of the commodity.
|
Change in supply due to the change in factors other than price.
|
||||||||||||||||||||||||
|
Alternative name
|
Movement along the supply curve:
|
Shift in supply curve:
|
||||||||||||||||||||||||
|
(i) Expansion in supply.
|
(i) Increase in supply.
|
|||||||||||||||||||||||||
|
(ii) Contraction in supply.
|
(ii) Decrease in supply.
|
|||||||||||||||||||||||||
|
Meaning
|
(i) It states that rise in quantity supplied due to the rise in price of the commodity.
|
(i) An increase in supply means that producers now supply more at a given price level.
|
||||||||||||||||||||||||
|
(ii) It states that fall in quantity supplied due to the fall in price of the commodity.
|
(ii) A decrease in supply means that producers now supply less at a given price level.
|
|||||||||||||||||||||||||
|
Schedule
|
|
|
||||||||||||||||||||||||
|
Diagrams
|
 |
 |
||||||||||||||||||||||||
Generate a complete, print-ready paper with questions like this in minutes — across 16+ boards, with answer keys.
|
Output units
|
Total cost Rs.
|
Average variable cost Rs.
|
Marginal cost Rs.
|
Average fixed cost Rs.
|
|
0
|
30
|
|
|
|
|
1
|
---
|
---
|
20
|
---
|
|
2
|
68
|
---
|
---
|
---
|
|
3
|
84
|
18
|
---
|
---
|
|
4
|
---
|
---
|
18
|
---
|
|
5
|
125
|
19
|
---
|
6
|
|
Output
(units)
|
Total Revenue
(₹)
|
Total Cost
(₹)
|
| 1 | 6 | 7 |
| 2 | 12 | 13 |
| 3 | 18 | 17 |
| 4 | 24 | 23 |
| 5 | 30 | 31 |
|
S No
|
|
|
|
1.
|
Investment in fixed assets
|
(Rs Thousand)
|
|
2.
|
Borrowings at 12% interest per annum.
|
2000
|
|
3.
|
Wages paid during the year
|
1500
|
|
4.
|
Annual rental value of the owner's factory building
|
120
|
|
5.
|
Annual depreciation
|
100
|
|
6.
|
Estimated annual value of the management services of the owner
|
100
|