Question
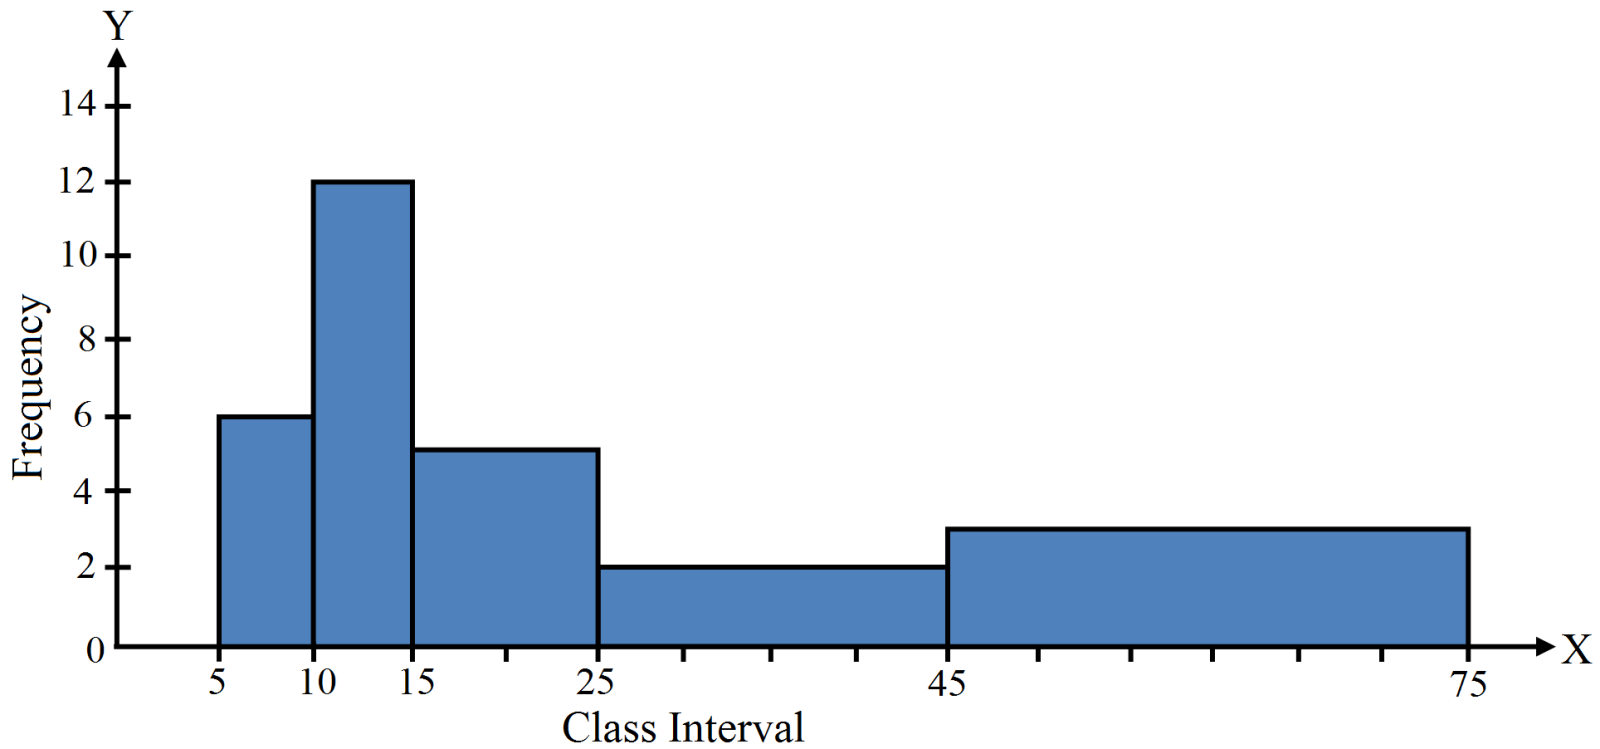
Draw a histogram to represent the following information:
|
Class interval
|
5-10
|
10-15
|
15-25
|
25-45
|
45-75
|
|
Frequency
|
6
|
12
|
10
|
8
|
18
|