Question
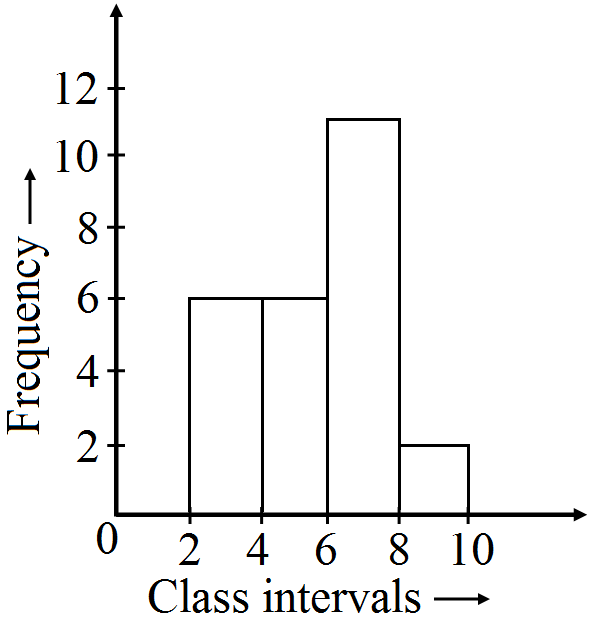
Draw a histogram to represent the frequency distribution in question $91$.
Generate a complete, print-ready paper with questions like this in minutes — across 16+ boards, with answer keys.
| Number of students | $100$ | $125$ |
| Number of days | $20$ | $y$ |