Question
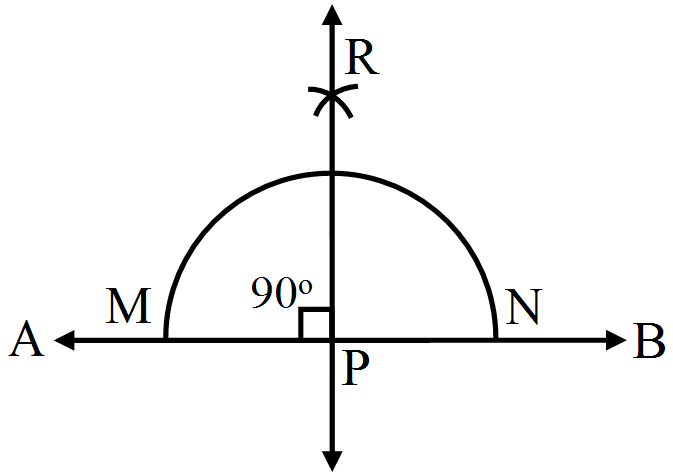
Draw a line $AB.$ Take a point $P$ on it. Draw a line passing through $P$ and perpendicular to $AB.$

Answer


Steps for construction:
$1.$Draw a line $AB$.
$2.$Take a point $P$ on line $AB.$
$3.$With $P$ as the centre, draw an arc of any radius, which intersects line $AB$ at $M$ and $N,$ respectively.
$4.$With $M$ as the centre and radius more than half of $MN,$ draw an arc.
$5.$With $N$ as the centre and the same radius as in step $(4),$ draw an arc that cuts the previously drawn arc at $R.$
$6.$Draw $PR. PR$ is the required line, which is perpendicular to $AB.$

Need a full question paper?

Generate a complete, print-ready paper with questions like this in minutes — across 16+ boards, with answer keys.

Start Generating Free

Similar questions

Solve the following equation and verify the answer:$\frac{\text{n}}{4}-5=\frac{\text{n}}{6}+\frac{1}{2}$
If m is a whole number less than $5,$ complete the table and by inspection of the table, find the solution of the equation $2m - 5 = -1:$
$m$          
$2m - 5$          
Find. Write and indicate how you solved this. Is $\frac9{16}$ equal to$\frac59$?
Draw a line segment of length $10\ cm$ and bisect it. Further bisect one of the equal parts and measure its length.
In a Mathematics test, the marks were obtained by $40$ students. Arrange these marks in a table using tally marks.
$8$ $1$ $3$ $7$ $6$ $5$ $5$ $4$ $4$ $2$
$4$ $9$ $5$ $3$ $7$ $1$ $6$ $5$ $2$ $7$
$7$ $3$ $8$ $4$ $2$ $8$ $9$ $5$ $8$ $6$
$7$ $4$ $5$ $6$ $9$ $6$ $4$ $4$ $6$ $6$
Find how many students obtained marks equal to or more than $7.$
Using a pair of compasses construct the following angles: $60^\circ $
 
The following data gives the amount of mature (in thousand tones) manufactured by a company during some years:
Year $1992$ $1993$ $1994$ $1995$ $1996$ $1997$
Manure (in thousand tonnes) $15$ $35$ $45$ $30$ $40$ $20$
$i.\ $Represent the above data with the help of a bar graph.
$ii.\ $Indicate will the help of the bar graph the year in which the amount of manure manufactured by the company was maximum.
$iii.\ $Choose the correct alternative.
The consecutive years during which there was a maximum decrease in manure production are:
$a.\ 1994$ and $1995$
$b.\ 1992$ and $1993$
$c.\ 1996$ and $1997$
$d.\ 1995$ and $1996$
 
By using tracing paper compare the angles in each of the pairs given in Fig.
Image
Write shaded portion as fraction. Arrange them in ascending and descending order correct sign $'<', '=', '>'$ between the fractions.