Question
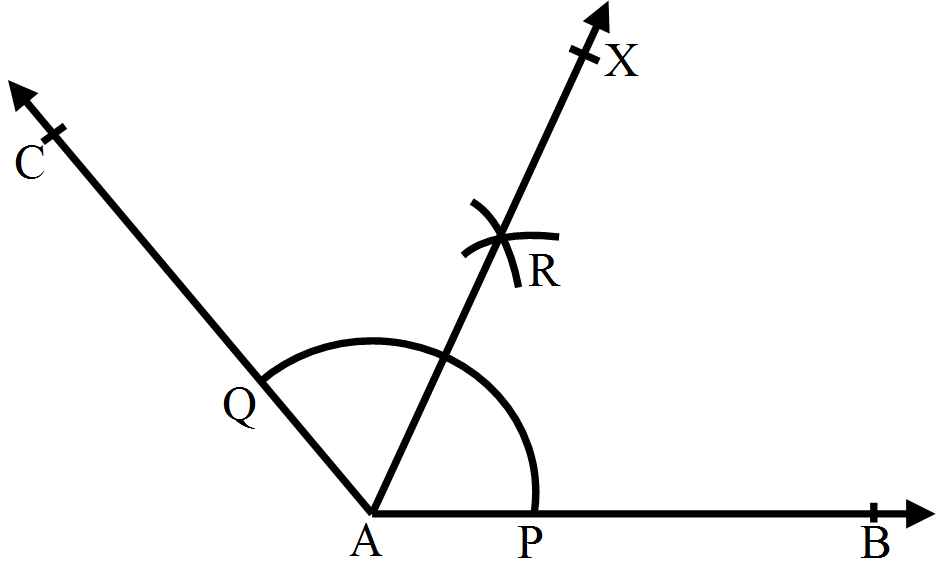
Draw an obtuse angle. Bisect it. Measure each of the angles so obtained.

Answer

Obtuse angles are those angles which are greater than $90^\circ $ but less than $180^\circ .$
Draw an obtuse angle $\angle\text{BAC}.$
With an appropriate radius and centre at $A,$ draw an arc such that it intersects $AB$ and $AC$ at $P$ and Q, respectively.

With centre $P$ and radius more than half of $PQ,$ draw an $ARC.$
With the same radius and centre at $Q,$ draw another arc intersecting the previous arc at $R.$
Join $A$ and $R$ and extend it to $X.$
The ray $AX$ is the required bisector of $\angle\text{BAC}.$
If we measure $\angle\text{BAR}$ and $\angle\text{CAR},$
we have $\angle\text{BAR}=\angle\text{CAR}=65^{\circ}$

Need a full question paper?

Generate a complete, print-ready paper with questions like this in minutes — across 16+ boards, with answer keys.

Start Generating Free

Similar questions

What part of a revolution have you turned through if you stand facing south and turn clockwise to face east?
Find the $HCF$ of the numbers in the following using the division method:$391, 425, 527$
Arrange the following numbers in ascending order: $9873426, 24615019, 990357, 9874012, 24620010$
Consider the numbers in the following boxes:
Image
Using these numbers and the operations addition and subtraction, we can write: $39,800=40,000-800+300+300$
Similarly, write the following numbers by using the numbers in the boxes:
$45,000 ; 5,900 ; 17,500 ; 21,400$
List any four symmetrical objects from your home or school. Also mention the line of symmetry.
The following data gives the production of foodgrains (in thousand tonnes) for some years:
Year199519961997199819992000
Production (in thousand tonnes)120150140180170190
Represent the above data with the help of a bar graph.
With $\overline{\text{PQ}}$ of length $6.1\ cm$ as diameter, draw a circle.
The following table gives the data of number of schools (stage-wise) of a country in the year $2002.$
Stage Number of schools (in thousands)
Primary $80$
Upper Primary $55$
Secondary $30$
Higher Secondary $20$
Draw a bar graph to represent the above data.
If the cost of $5$ bars of a soap is $Rs. 30,$ then the cost of one dozen bars is: