Question
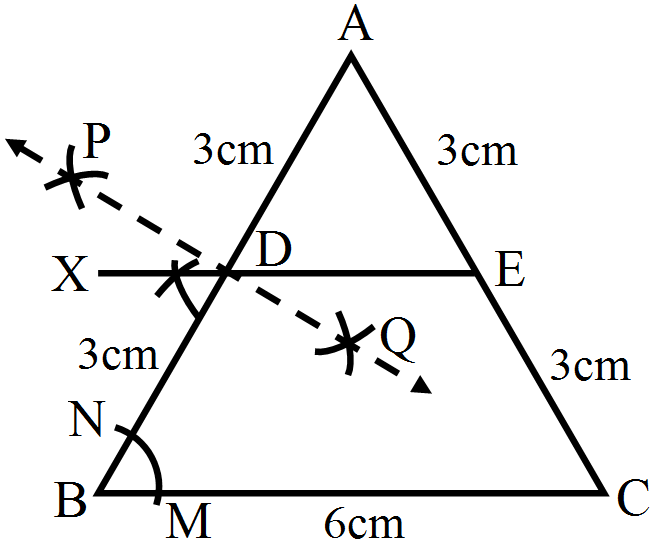
Draw any $\triangle\text{ABC}.$ Bisect side AB at D. Through D, draw a line parallel to BC, meeting AC in E. Measure AE and EC.

Answer


Steps of construction:
Step I: We first draw a triangle ABC with each side = 6cm.
Steps to bisect line AB:
Step I: Draw an arc from A on either side of line AB.
Step II: With the same radius as in the previous step, draw an arc from B on either side of AB intersecting the arcs drawn in the previous step at P and Q.
Step III: Join PQ cutting AB at D. PQ is the perpendicular bisector of AB.
Parallel line to BC:
Step I: With B as centre, draw an arc cutting BC and BA at M and N, respectively.
Step II: With centre D and the same radius as in the previous step, draw an arc on the opposite side of AB to cut AB at Y.
Step II: With centre Y and radius equal to MN, draw an arc cutting the arc drawn in the previous step at X.
Step III: Join XD and extend it to intersect AC at E.
Step IV: DE is the required parallel line.

Need a full question paper?

Generate a complete, print-ready paper with questions like this in minutes — across 16+ boards, with answer keys.

Start Generating Free

Similar questions

The maximum and minimum temperatures of five Indian cities are given in °C. Draw a joint bar graph for this data.
MumbaiKolkataNagpurKapurthala
3747wQbNPTDJp9hMYdvogK2hAUiHsGeiybwaWe36bwtRQ3UTpYV7YuZ8FV5j9nauFCWwcjM6dTzpL5s2N79Rp5unwdMvc8ZKU>2625262926
Construct a $\triangle\text{PQR}$ in which QR = 6cm, PQ = 4.4cm and PR = 5.3cm. Draw the bisector of $\angle\text{P.}$
In a survey or 85 families of a colony, the number of members in each family was recorded, and the data has been represented by the following bar graph:

Read the bar graph carefully and answer the questions given below:
  1. What information does the bar graph give?
  2. How many families have 3 members?
  3. How many people live alone?
  4. Which type of family is the most common? How many members are there in each family of this kind?
Suman studies for $5\frac{2}{3}$ hours daily. She devotes $2\frac{4}{5}$ hours of her time lor Science and Mathematics. How much time does she devote for other subjects?
In each of the following examples, write all the factors of the numbers and find the greatest common divisor.
i. 28, 42
ii. 51, 27
iii. 25, 15, 35
Observe the adjacent figure and answer the following questions :
Image


  1. Write the names of the angles in the figure alongside.
  2. What type of a pair of angles is it?
  3. Which arms of the angles are not the common arms?
  4. m∠PQR = __.
  5. m∠RQS = __.
The following table shows the life expectancy (average age to which people live) in various countries in a particular year. Represent this data by a bar graph.
Country
Japan
India
Britain
Ethiopia
Cambodia
Life expectancy (in years)
76
57
70
43
36
The number of saplings planted by schools on World Tree Day is given in the table below. Draw a joint bar graph to show these figures. School Name\Name of Sapling
AlmondKaranjNeemAshokGulmohar
Nutan Vidyalaya4060721542
Bharat Vidyalaya4238602540
Compare the following fractions by using the symbo > or < or =
$\frac{17}{15}\text{ and }\frac{119}{105}$
Arrange the following fraction in descending order:
$\frac{2}{7},\frac{11}{35},\frac{9}{14},\frac{13}{28}$