Question
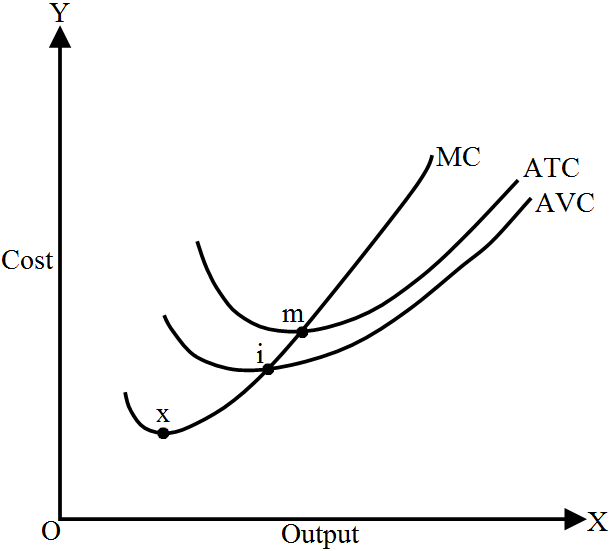
Draw Average Variable Cost (AVC), Average Total Cost (ATC) and Marginal Cost (MC) curves in a single diagram. State the relation between MC curve and AVC and ATC curves.

Answer

Relation between MC curve and AVC and ATC curves:

  • When MC is lower than ATC or AVC, then ATC or AVC falls.
  • When MC = ATC or AVC, then ATC or AVC is constant. (MC curve intersects both the AVC curve and ATC curve at their minimum points, (l and m) from below.
  • When MC is greater than ATC or AVC, then ATC or AVC rises.

Need a full question paper?

Generate a complete, print-ready paper with questions like this in minutes — across 16+ boards, with answer keys.

Start Generating Free

Similar questions

Why does marginal cost eventually rise as output increases?
At a price of 40 per unit, the quantity supplied of a commodity is 400 units. When its price falls by 10 percent, its quantity supplied falls by 36 units. Calculate its elasticity of supply. Is its supply elastic?
Suppose a bond promises Rs. 500 at the end of two years with no intermediate return. If the rate of interest is 5 per cent per annum what is the price of the bond?
There are three firms A, B and C in a market. The supply schedule for the market and that for firms A and B is given below. Prepare the supply schedule for firm C.
Price(₹) Supply of Firm A Supply of Firm B Supply of Firm C Market Supply MS = SA + SB + SC
10 0 25 -- 35
20 10 30 -- 60
30 20 35 -- 85
40 30 40 -- 110
50 40 45 -- 135
60 50 50 -- 160
Calculate MC and TC from the following cost schedule of a firm whose total fixed cost is ₹ 15.
Output (Units)
1
2
3
4
Marginal Cost ()
10
19
29
40
A consumer consumes only two goods A and B and is in equilibrium. Show that when price of good B falls, demand for B rises. Answer this question with the help of utility analysis.
Given below is the cost schedule of a firm. Its total fixed cost is Rs.120. Calculate the marginal cost and average variable cost at each level of output.
Output (Units)
1
2
3
Average Cost ()
160
96
80
From the following schedule, calculate TR, AR and MR.
Price (P) (₹) 6 7 8
Units sold (Q) 5 4 3
Explain the role of reverse repo rate in controlling money supply.
Distinguish between ‘fiscal deficit’ and ‘revenue deficit’. What does fiscal deficit indicate?