Question
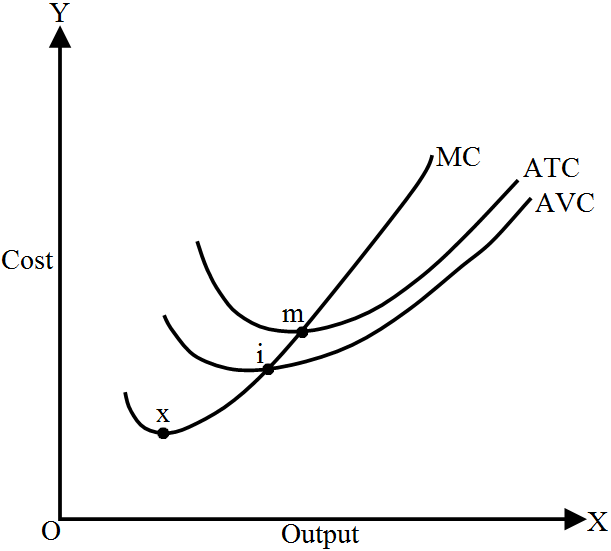
Draw Average Variable Cost (AVC), Average Total Cost (ATC) and Marginal Cost (MC) curves in a single diagram. State the relation between MC curve and AVC and ATC curves.
Generate a complete, print-ready paper with questions like this in minutes — across 16+ boards, with answer keys.
| Price (₹) | 10 | 11 | 12 | 13 | 14 | 15 | 16 |
| Units Sold | - | 9 | - | 7 | - | 5 | - |
| TR (₹) | 100 | - | 96 | - | 84 | - | 64 |
| MR (₹) | - | - | - | - | - | - | - |