Question
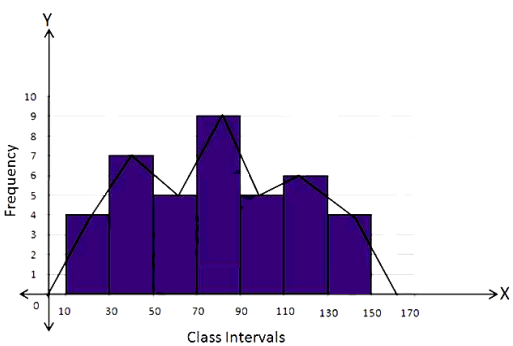
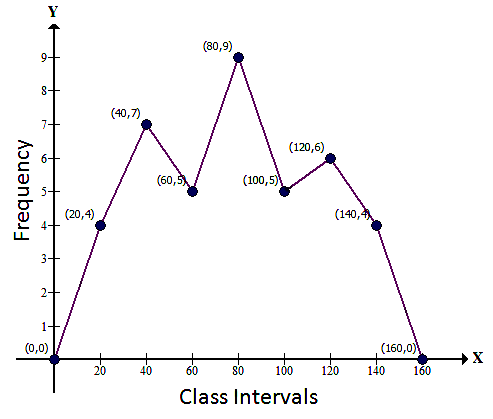
Draw frequency polygons for each of the following frequency distribution: $(a)$ using histogram$(b)$ without using histogram
$C.I$ $10 - 30$ $30 - 50$ $50 - 70$ $70 - 90$ $90 - 110$ $110 - 130$ $130 - 150$
$ƒ$ $4$ $7$ $5$ $9$ $5$ $6$ $4$

Answer

using histogram
$C.I$ $ƒ$
$10 - 30$ $4$
$30 - 50$ $7$
$50 - 70$ $5$
$70 - 90$ $9$
$90 - 110$ $5$
$110 - 130$ $6$
$130 - 150$ $4$
Steps:
    1. Draw a histogram for the given data.
    2. Mark the mid$-$point at the top of each rectangle of the histogram drawn.
    3. Also, mark the mid$-$point of the immediately lower class$-$interval and mid$-$point of the immediately higher class$-$interval.
    4. Join the consecutive mid$-$points marked by straight lines to obtain the required frequency polygonImage
Without using Histogram:Steps:
  1. Find the class$-$mark$ ($mid$-$value$)$ of each given class$-$interval.
    classmark $=$ mid$-$value =$\frac{\text { Upper limit }+ \text { Lower limit }}{2}$
  2. On a graph paper, mark class$-$marks along $X-$axis and frequencies along$ Y-$axis.
  3. On this graph paper, mark points taking values of class$-$marks along the $X-$axis and the values of their corresponding frequencies along $Y-$axis.
  4. Draw line segments joining the consecutive points marked in step $(3)$ above.
    $C.I.$ $Class-mark$ $f$
    $-10 - 10$ $0$ $0$
    $10 - 30$ $20$ $4$
    $30 - 50$ $40$ $7$
    $50 - 70$ $60$ $5$
    $70 - 90$ $80$ $9$
    $90 - 110$ $100$ $5$
    $110 - 130$ $120$ $6$
    $130 - 150$ $140$ $4$
    $150 - 170$ $160$ $0$

Need a full question paper?

Generate a complete, print-ready paper with questions like this in minutes — across 16+ boards, with answer keys.

Start Generating Free