Question
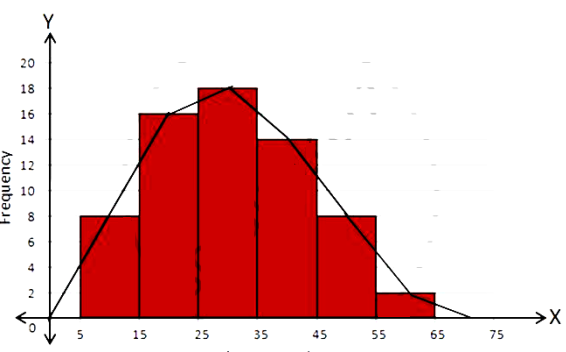
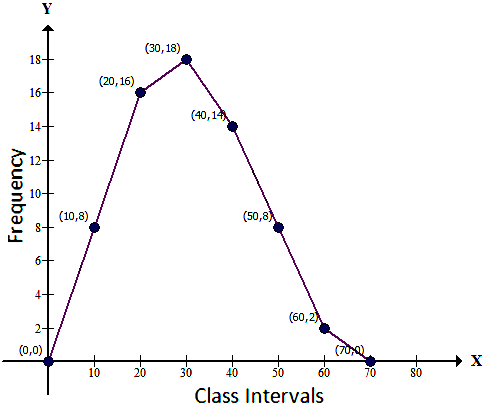
Draw frequency polygons for each of the following frequency distribution:$(a)$ using histogram$(b)$ without using histogram
$C.I$ $5 -15$ $15 -25$ $25 -35$ $35 - 45$ $45-55$ $55-65$
$ƒ$ $8$ $16$ $18$ $14$ $8$ $2$

Answer

Using Histogram:
$C.I.$ $f$
$5 - 15$ $8$
$15 - 25$ $16$
$25 - 35$ $18$
$35 - 45$ $14$
$45 - 55$ $8$
$55 - 65$ $2$
Steps:
  1. Draw a histogram for the given data.
  2. Mark the mid$-$point at the top of each rectangle of the histogram drawn.
  3. Also, mark the mid$-$point of the immediately lower class$-$interval and mid$-$point of the immediately higher class$-$interval.
  4. Join the consecutive mid$-$points marked by straight lines to obtain the required frequency polygon.

Image
Without using Histogram:
$1$. Find the class$-$mark $($mid$-$value$)$ of each given class$-$interval.
$2.$. On a graph paper, mark class$-$marks along $X$-axis and frequencies along $Y-$axis.
$3.$ On this graph paper, mark points taking values of class$-$marks along the $X-$axis an values of their corresponding frequencies along the $Y-$axis.
$4.$ Draw line segments joining the consecutive points marked in step $(3)$ above.
$C.I.$ Class$-$mark $f$
$-5 - 5$ $0$ $0$
$5 - 15$ $10$ $8$
$15 - 25$ $20$ $16$
$25 - 35$ $30$ $18$
$35 - 45$ $40$ $14$
$45 - 55$ $50$ $8$
$55 - 65$ $60$ $2$
$65 - 75$ $70$ $0$

Need a full question paper?

Generate a complete, print-ready paper with questions like this in minutes — across 16+ boards, with answer keys.

Start Generating Free