Question
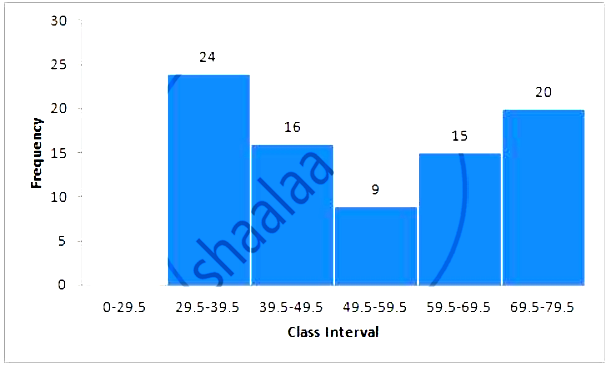
Draw histrogram for the following distributions:
| Class interval | 30-39 | 40-49 | 50-59 | 60-69 | 70-79 |
| Frequency | 24 | 16 | 09 | 15 | 20 |
| Class interval | 30-39 | 40-49 | 50-59 | 60-69 | 70-79 |
| Frequency | 24 | 16 | 09 | 15 | 20 |
| Class Interval (Inclusive from ) | Class Interval (Exclusive from) | Frequency |
| 30-39 | 29.5-39.5 | 24 |
| 40-49 | 39.5-49.5 | 16 |
| 50-59 | 49.5-59.5 | 09 |
| 60-69 | 59.5-69.5 | 15 |
| 70-79 | 69.5-79.5 | 20 |
Generate a complete, print-ready paper with questions like this in minutes — across 16+ boards, with answer keys.