Question
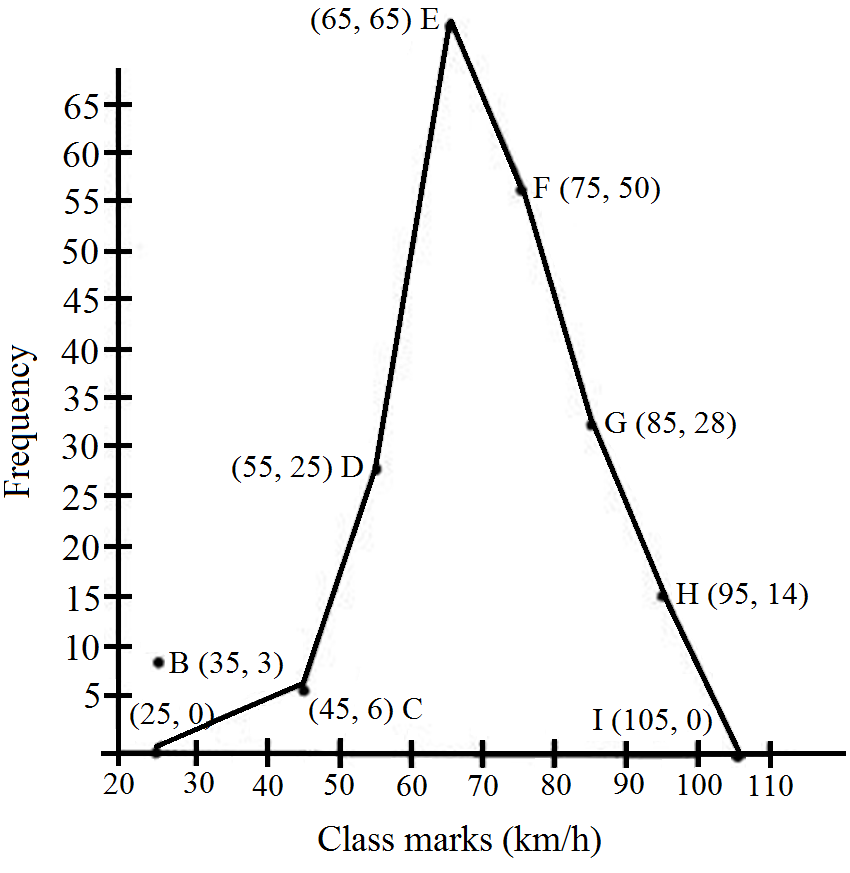
Draw the frequency polygon representing the above data without drawing the histogram.
|
Class interval (km/ h)
|
Class marks
|
Frequency
|
|
$30-40$
$40-50$
$50-60$
$60-70$
$70-80$
$80-90$
$90-100$
|
$35$
$45$
$55$
$65$
$75$
$85$
$95$
|
$3$
$6$
$25$
$65$
$50$
$28$
$14$
|
Generate a complete, print-ready paper with questions like this in minutes — across 16+ boards, with answer keys.
| Year | $1960-61$ | $1970-71$ | $1980-81$ | $1990-91$ | $2000-2001$ |
| Route lenght (in thousand Km) | $56$ | $60$ | $61$ | $74$ | $98$ |