Question
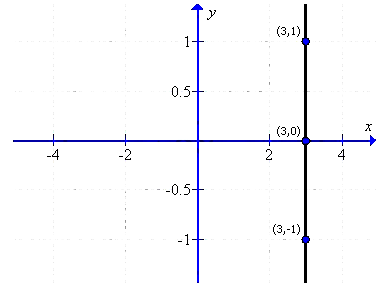
Draw the graph for the linear equation given below$:x = 3$
| $x$ | $3$ | $3$ | $3$ |
| $y$ | $-1$ | $0$ | $1$ |
Generate a complete, print-ready paper with questions like this in minutes — across 16+ boards, with answer keys.
| Class$-$intervals | $0-4$ | $4 - 8$ | $8 - 12$ | $12 - 16$ | $16 - 20$ | $20 - 24$ |
| Frequency | $4$ | $7$ | $10$ | $15$ | $11$ | $6$ |