Question
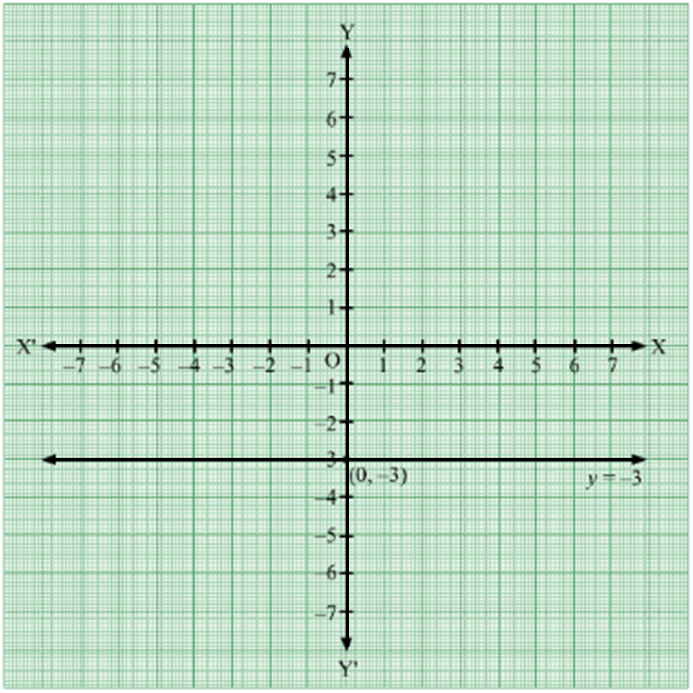
Draw the graph of the following equation.
y = -3
y = -3
Generate a complete, print-ready paper with questions like this in minutes — across 16+ boards, with answer keys.
|
Daily wages $($in $Rs.)(x_i)$
|
$250$ | $300$ | $350$ | $400$ | $450$ |
|
Number of workes $(f_i)$
|
$8$ | $11$ | $6$ | $10$ | $5$ |