Question
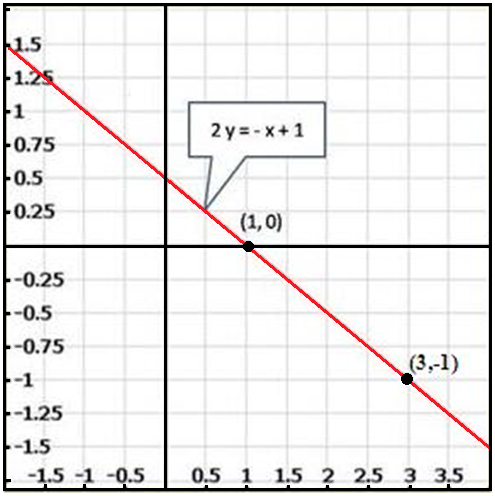
Draw the graph of the following linear equations in two variables: $2y = -x + 1$
Generate a complete, print-ready paper with questions like this in minutes — across 16+ boards, with answer keys.
|
No. of heads per toss
|
No. of tosses
|
|
$0$
|
$38$
|
|
$1$
|
$144$
|
|
$2$
|
$342$
|
|
$3$
|
$287$
|
|
$4$
|
$164$
|
|
$5$
|
$25$
|
|
Total
|
$1000$
|
|
Heights (in cm)
|
Number of students
|
|
$150-153$
$153-156$
$156-159$
$159-162$
$162-165$
$165-168$
|
$7$
$8$
$14$
$10$
$6$
$5$
|
|
Monthly Income
$($in $₹)$
|
Vechicles Per Family
|
|||
|
$0$
|
$1$
|
$2$
|
Above $2$
|
|
|
Less than $7000$
|
$10$
|
$160$
|
$25$
|
$0$
|
|
$7000 – 10000$
|
$0$
|
$305$
|
$27$
|
$2$
|
|
$10000 – 13000$
|
$1$
|
$535$
|
$29$
|
$25$
|
|
$13000 – 16000$
|
$2$
|
$469$
|
$29$
|
$25$
|
|
$16000$ or more
|
$1$
|
$579$
|
$82$
|
$88$
|