Question
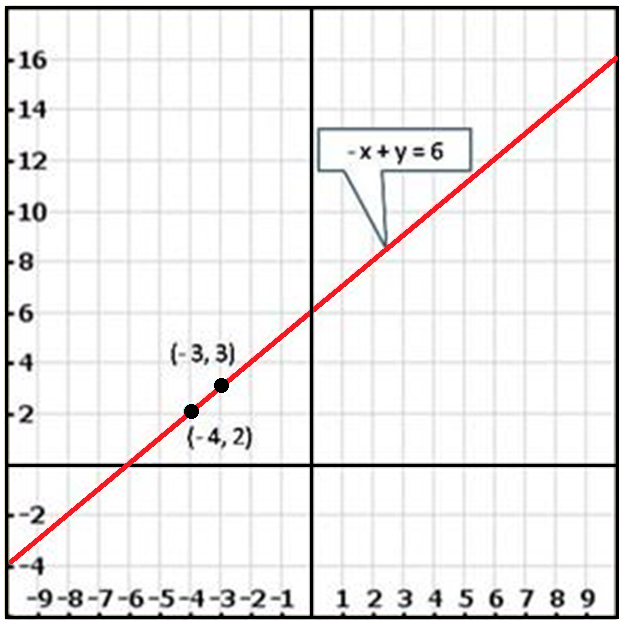
Draw the graph of the following linear equations in two variables:$ -x + y = 6$
Generate a complete, print-ready paper with questions like this in minutes — across 16+ boards, with answer keys.
|
Class interval
|
Frequency
|
|
$150-153$
$154-157$
$158-161$
$162-165$
$166-169$
$170-173$
|
$7$
$7$
$15$
$40$
$5$
$6$
|