Question
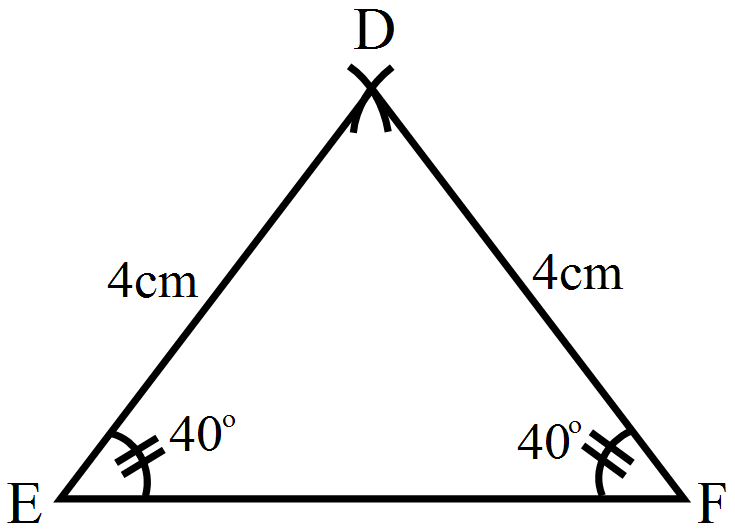
Draw $\triangle\text{DEF}$ such that DE= DF= 4cm and EF = 6cm. Measure $\angle\text{E}$ and $\angle\text{F}.$

Answer


Steps of construction:
Step I: Draw a line segment EF of length 6cm.
Step II: With E as centre, draw an arc of radius 4cm.
Step III: With F as centre, draw an arc of radius 4cm intersecting the previous arc at D.
Step IV: Join DE and DF to get the desired triangle DEF.
Step V: By measuring we get, $\angle\text{E}=\angle\text{F}=40^\circ.$

Need a full question paper?

Generate a complete, print-ready paper with questions like this in minutes — across 16+ boards, with answer keys.

Start Generating Free

Similar questions

Find the missing frequency (p) for the following distribution whose mean is 7.68
x:
3
5
7
9
11 13
f:
6
8
15
p
8 4
The production of saleable steel in some of the steel plants of our country during 1999 is given below:
Plant
Bhilai
Durgapur
Rourkela
Bokaro
Production(in thousand tonnes)
160
80
200
150
Construct a bar graph to represent the above data on a graph paper by using the scale 1 big division=20 thousand tonnes.
Arrange the following fraction in descending order:
$\frac{4}{5},\frac{7}{10},\frac{11}{15},\frac{17}{20}$
Find the products:
Multiply $-\frac{2}{3}\text{a}^2\text{b by }\frac{6}{5}\text{a}^3\text{b}^2$ and verify your result for a = 2 and b = 3.
In a survey or 85 families of a colony, the number of members in each family was recorded, and the data has been represented by the following bar graph:

Read the bar graph carefully and answer the questions given below:
  1. What information does the bar graph give?
  2. How many families have 3 members?
  3. How many people live alone?
  4. Which type of family is the most common? How many members are there in each family of this kind?
The birth rate per thousand in five countries over a period of time is shown below:
Country China India Germany UK Sweden
Birth rate per thousand 42 35 14 28 21
Represent the above data by a bar graph.
Find the time when:
Divide Rs. 3600 into two parts such that if one part be lent at 9% per annum and the other at 10% per annum, the total annual income is Rs. 333.
In Fig, P is the point on the side BC. Complete each of the following statements using symbol ‘=’,’ > ‘or ‘< ‘so as to make it true:
  1. AP… AB+ BP
  2. AP… AC + PC
  3. $\text{AP}...\frac{1}{2}(\text{AB}+\text{AC}+\text{BC})$
The following data gives the number (in thousands) of applicants registered with an Employment Exchange during, 1995-2000:
Year 1995 1996 1997 1998 1999 2000
Number of applicants(in thousands) 18 20 24 28 30 34
Construct a bar graph to represent the above data.
Take any three non-collinear points A, B, C and draw $\angle\text{ABC}.$ Through each vertex of the triangle, draw a line parallel to the opposite side.