Question
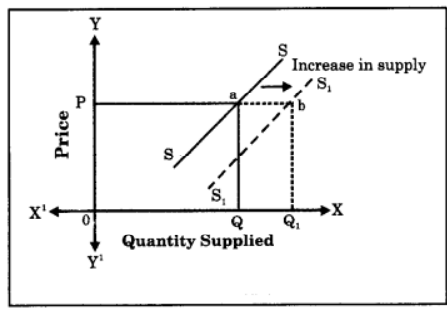
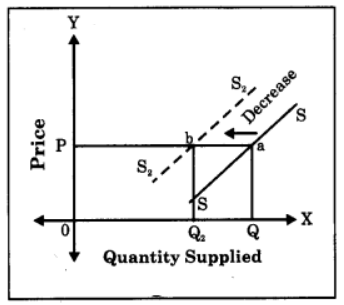
Explain change in supply with the help of diagram.
OR
Explain increase in supply and decrease in supply.

Answer

Changes in supply occurs when the quantity supplied changes due to changes in factors other than price.
Changes in Supply are of two types :
(A) Increase in Supply
(B) Decrease in Supply(A) Increase in Supply : It means when more quantity is supplied at the same price. Increase in supply occurs due to changes in factors other than change in price. It takes place when –
1. There is decrease in price of inputs
2. There is technological upgradation
3. Imports are more
4. There is decrease in tax, etc.
Increase in supply is shown by a shift in i the supply curve to the right of the original; supply curve.


Image
In the diagram, at OP price when quantity supplied rises from OQ to $OQ _1$ it indicates) an increase in supply. This is shown by a c shift in supply curve from SS to $S _1 S_1$ to the right.
(B) Decrease in Supply: It means when less quantity is supplied at the same price.
Decrease in supply occurs due to change in factors other than change in price. It takes place when -
1. there is increase in price of inputs,
2. technological degradation or out dated technology used.
3. exports are more.
4. there is increase in taxes etc.
Decrease in supply is shown by a shift in the supply curve to the left of the original supply curve.
Image
At $OP$ price when quantity supplied falls from $OQ$ to $OQ_2$​​​​​​​, it indicates a decrease in supply. This is shown by a shift in supply curve from $SS$ to $S2S2$ to the left.

Need a full question paper?

Generate a complete, print-ready paper with questions like this in minutes — across 16+ boards, with answer keys.

Start Generating Free