Gujarat BoardEnglish MediumSTD 7ScienceMotion and Time3 Marks
Question
Explain how we can plot a graph.
✓
Answer
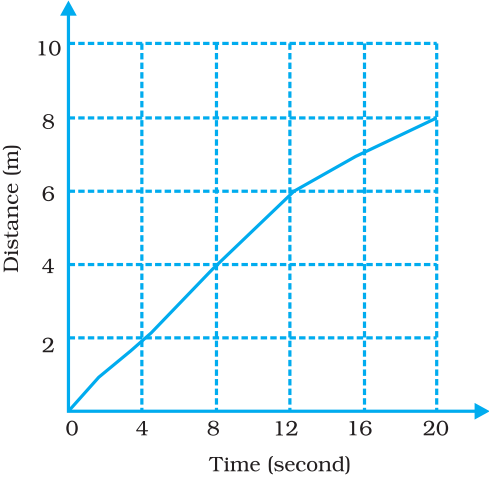
To plot a graph on a graph sheet:Take a graph paper. At the centre of the paper, draw two lines perpendicular to each other Mark the point of intersection of the lines as $'O'$. The horizontal line is called the $X$-axis, while the vertical line is called the $Y$-axis. The point of intersection of the two axes is called the origin, $"O"$. Take one quantity along the $X$-axis and the other along the $Y$-axis, after choosing suitable scales for both. For every value along one axis, mark a point matching the related value on the other axis. Join the points, and your graph is ready.
Need a full question paper?
Generate a complete, print-ready paper with questions like this in minutes — across 16+ boards, with answer keys.