Question
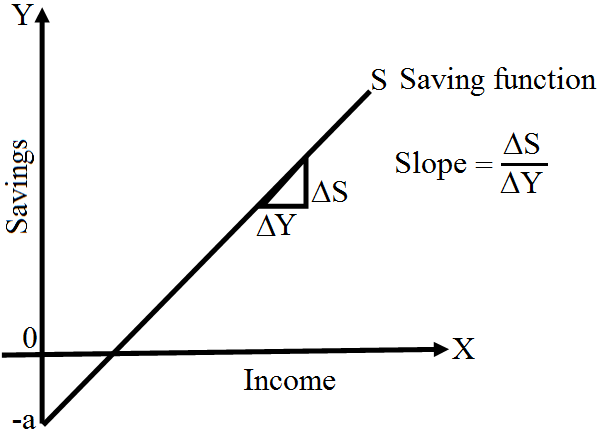
Explain the components of saving function:$\text{S}=-\bar{}\text{C}+(1-\text{b})\text{Y}.$

Answer

The saving function is:$\text{S}=\bar{}\text{C}+(1-\text{b})\text{Y}.$
Here, $-\bar{\text{C}}$ is called the intercept and it represents the amount of savings done when there is zero level of income. Savings is negative at zero level of income because at zero level of income, consumption (a) is positive. Negative savings is nothing but dissaving, this means that at zero level of income there is dissaving of amount-a.
Note: a can also be denoted by $-\bar{\text{C}},\text{i.e}.,-\text{a}-\bar{\text{C}}.$
The coefficient (1 - b) measures the slope of the savings function. The slope of the savings function gives the increase in savings to per unit increase in income. This is known as marginal propensity to save (MPS). Since b, i.e., MPC is less than one, it follows that (1 - b), i.e., MPS is positive. Savings is an increasing function of income. The given figure illustrates the idea.

Need a full question paper?

Generate a complete, print-ready paper with questions like this in minutes — across 16+ boards, with answer keys.

Start Generating Free

Similar questions

Explain the process of money creation by the commercial banks with the help of a numerical example.
Why does the demand for foreign currency fall and supply rises when its price rises? Explain.
Giving reasons, explain how the following are treated in estimating national income:
  1. Wheat grown by a farmer but used entirely for family’s consumption.
  2. Earnings of the shareholders from the sale of shares.
  3. Expenditure by government on providing free education.
Draw a hypothetical propensity to consume curve and from it draw the propensity to save curve.
OR
Explain the steps taken in derivation of the saving curve from the consumption curve. Use diagram.
Explain the production method of estimating national income.
Explain determination of equilibrium level of income using consumption plus investment (C + l) approach. Use diagram.
How will you treat the following while estimating domestic product of a country? Give reasons for your answer:
  1. Profits earned by branches of country’s bank in other countries.
  2. Gifts given by an employer to his employees on independence day.
  3. Purchase of goods by foreign tourists.
Suppose that for a particular economy, investment is equal to 200, government purchases are 150, net taxes (that is lump-sum taxes minus transfers) is 100 and consumption is given by C = 100 + 0.75Y,
  1. What is the level of equilibrium income?
  2. Calculate the value of the government expenditure multiplier and the tax multiplier.
  3. If government expenditure increases by 200, find the change in equilibrium income.
In an economy, Aggregate Demand is less than Aggregate Supply. Is the economy in equilibrium? If not, explain the changes that will bring the economy in equilibrium.
Complete the following table:
Income (Rs) Consumption expenditure (Rs) Marginal propensity to save Average propensity to save
0 80    
100 140 0.4 ……..
200 ………. ………. 0
…….. 240 …….. 0.20
…….. 260 0.8 0.35