Question
Explain the conditions of consumer's equilibrium using indifference curve analysis.
OR
consumer consumes only two goods. Explain the conditions of consumer equilibrium with the help of indifference curve analysis. Use diagram.
OR
Explain the conditions of consumer equilibrium with the help of indifference curve analysis. Use diagram.
OR
Use indifference curve approach, explain the conditions of consumer's equilibrium.
OR
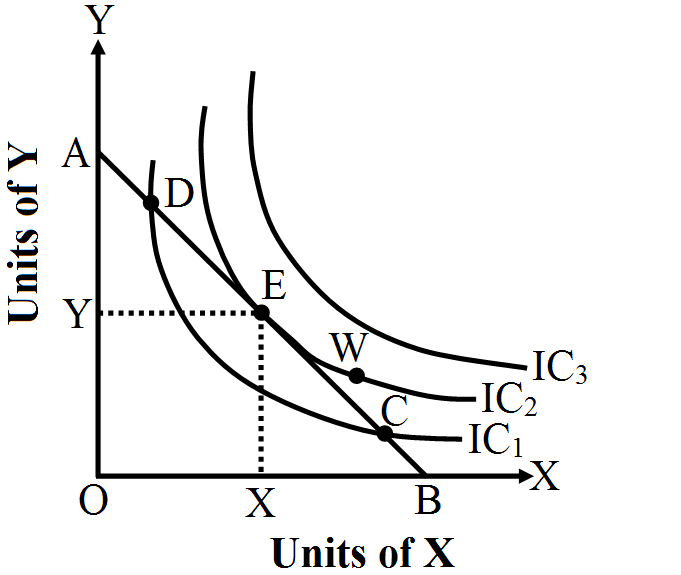
What are the conditions of consumer's equilibrium under indifference curve approach? What changes will take place if the conditions are not fulfilled to reach equilibrium?

Answer

Consumer equilibrium is defined as the level of consumption where the consumer derives maximum satisfaction from the consumption of commodities and does not have any desire to change from that level of consumption. The consumer will continue to substitute Y for X as long as the marginal rate of substitution is greater than or equal to the price ratio of both the commodities. The necessity of this condition can be explained with the help of the given diagram:

In the given diagram $IC_1, IC_2,$ and $IC_3$, represent the indifference map for the consumer representing the consumer's scale of preferences. AB represents the budget line which shows various combinations of the two commodities that a consumer can purchase from his given income and price of the commodities.
Consumer equilibrium is achieved at point E where the budget line is tangential to the indifference curve.
  1. If Marginal Rate of Substitution is greater than the price ratio or market rate of exchange: This is represented by point D in the given diagram. When the marginal rate of substitution is greater than the market rate of exchange then it would represent that the consumer is willing to sacrifice in a higher proportion as compared to the price ratio or market rate of exchange. Hence, the consumer becomes ready to consume more of X by sacrificing Y. Due to increase in consumption of X, the MRS between X and Y will fall. This process continues till the level where the marginal rate of substitution becomes equal to the market rate of exchange.
  2. Similarly, if MRS is less than the price ratio, then the consumer will become ready to consume less of X. Due to decrease in consumption of X, the MRS between X and Y will increase. This process continues till the level where MRS becomes equal to the market rate of exchange $\frac{\text{P}_\text{X}}{\text{P}_\text{Y}}.$
Hence, the consumer will be at equilibrium, i.e., the consumer's behaviour will be stable only if the marginal rate of substitution becomes equal to market rate of exchange.
No, the equality of MRS to price ratio or market rate of exchange is not enough to achieve equilibrium. The diminishing marginal rate of substitution or convexity of indifference curve is also a necessary condition to achieve equilibrium. In fact it is a necessary condition in order to achieve a unique equilibrium point for the consumer.

Need a full question paper?

Generate a complete, print-ready paper with questions like this in minutes — across 16+ boards, with answer keys.

Start Generating Free

Similar questions

What are the different phases in the Law of Variable Proportions in terms of marginal product? Give reason behind each phase. Use diagram.
What is meant by producer's equilibrium? Explain the conditions of producer's equilibrium through the 'total revenue and total cost' approach. Use diagram.
Elaborate three main features of oligopoly form of market.
Distinguish between a centrally planned economy and a market economy.
Identify the three phases of the Law of Variable Proportions from the following and also give reason behind each phase:
Units of Variable Input
(Units)
Total Physical Product
1 10
2 22
3 30
4 35
5 30
What is the supply curve of a firm in the long run?
State the behaviour of marginal product in the law of variable proportions. Explain the causes of this behaviour.
OR
Giving reasons, explain the law of variable proportion.
OR
What are the different phases in the Law of Variable Proportions in terms of marginal product? Give reason behind each phase. Use diagram.
Market of a commodity is in equilibrium. Demand for the commodity ‘increases’. Explain the chain of effects of this change till the market again reaches equilibrium. Use diagram.
Market for a good is in equilibrium. Supply of the good 'increases'. Explain the chain of effects of this change.
A consumer buys $10$ units of a commodity at a price of ₹ $10$ per unit. He incurs an expenditure of ₹ $200$ on buying $20$ units. Calculate Price Elasticity of Demand by percentage method. Comment on the shape of demand curve based on this information.