Elementary Theory of Demand — Economics STD 10 — Question
ICSE BoardEnglish MediumSTD 10EconomicsElementary Theory of Demand3 Marks
Question
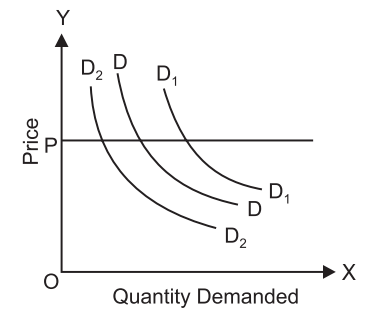
Explain the diagram given below.
✓
Answer
The diagram shows change in demand. DD is the initial demand curve. Price remaining the same (at OP level) when demand rises due to change in factors other than price, demand curve shifts from DD to D1D1 indicating increase in demand. Demand curve shifts to the left as denoted by demand curve D2D2 indicates decrease in demand when other factors become unfavourable.
Need a full question paper?
Generate a complete, print-ready paper with questions like this in minutes — across 16+ boards, with answer keys.