Question
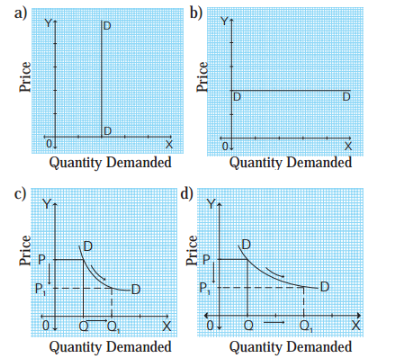
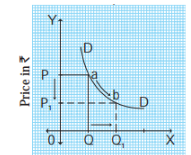
Explain the diagrams:
Get the step-by-step solution for this question inside the Vidyadip app.
Get the answer in the appGenerate a complete, print-ready paper with questions like this in minutes — across 16+ boards, with answer keys.
| Price in Rs. | Quantity supplied in units |
| 10 | 200 |
| 15 | ……… |
| 20 | 300 |
| 25 | 350 |
| 30 | …….. |
| 35 | …….. |
| 40 | …….. |
| Trends in Public Expense | ||
| Sr. No. | Year | Total Expense (Rs. in crores) |
| 1 | 1991-92 | 72,317 |
| 2 | 2001-02 | 3,62,450 |
| 3 | 2005-06 | 5,06,123 |
| 4 | 2009-10 | 10,24,487 |
| 5 | 2015-16 | 11,95,025 |
| 6 | 2016-17 | 13,74,203 |
| 7 | 2017-18 | 14,35,233 |
| 8 | 2018-19 | 17,29,682 |
QU 1. What was the total public expense in the year 2009-10?
QU 2. Calculate the difference between public expense of 1991-92 to 2001-02.
QU 3. Observe the trends in public expense from 2015 to 2019.
QU 4. What is the tendency of trends in public expense, shown in the given table?
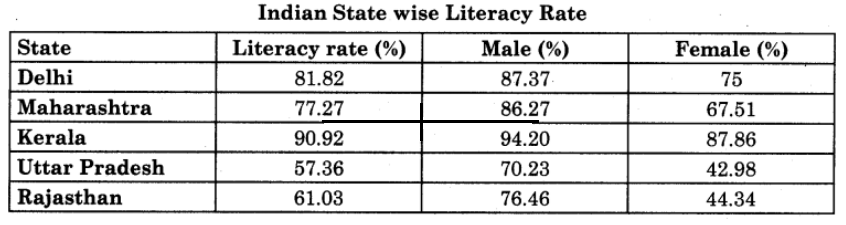
(1) Which state has the highest literacy [ rate?
(2) What is the male literacy rate for1 Maharashtra?
(3) What is difference of female literacy rate between Delhi and Rajasthan?
(4) Which states has highest male literacy and lowest female literacy rate?