Question
Explain the distinction between "change in quantity supplied" and "change in supply." Use diagram.

Answer

"Change in quantity supplied" means change in supply due to change In own price of the good. Diagrammatically, it implies movement along the supply curve. When the producer moves from A to B, the rise in quantity of the good from OQI to OQz is on account of rise in price from OPI to OP2. "Change in supply" means change in supply due to change in any factor; other than the own price of the good. Diagrammatically, it means shift of supply curve when producer moves from A to B; The price remains unchanged at OP while the supply curve shift from Sl to 52 When the producer shifts from $1to $2 the supply fall from OQI to OQ2.

Need a full question paper?

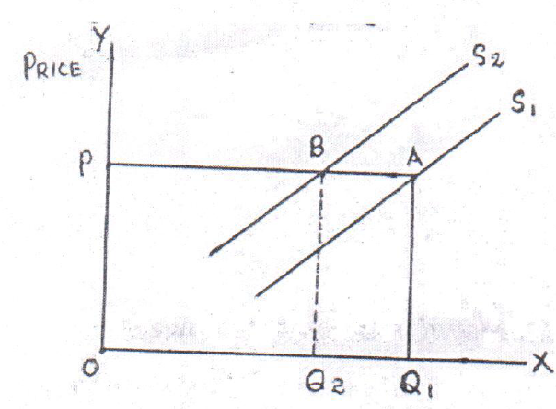
Generate a complete, print-ready paper with questions like this in minutes — across 16+ boards, with answer keys.

Start Generating Free

Similar questions

State whether the following statements are true or false. Give reasons for your answer.
  1. When total revenue is constant average revenue will also be constant.
  2. Average variable cost can fall even when marginal cost is rising.
  3. When marginal product falls, average product will also fall.
A consumer consumes only two goods. Explain his equilibrium with the help of utility approach.
A table showing TC and TR of a firm is given. Calculate MC and MR and find out the equilibrium level of output.
Output
1
2
3
4
5
6
7
8
9
10
TC
45
80
95
105
135
175
225
285
360
440
TR
40
80
120
160
200
240
280
320
360
400
A consumer buys $18$ units of a good at a price of ₹ $9$ per unit. The price elasticity of demand for the good is $(-)1$. How many units the consumer will buy at a price of $10$ ₹ per unit? Calculate.
State whether the following statements are true or false. Give reasons for your answer:
  1. When equilibrium price is greater than market price there will be excess supply in the market.
  2. X and Y are complementary goods. A fall in the price of Y will result in a rise in the price of X.
From the following information about a firm, find the firms equilibrium output in terms of marginal cost and marginal revenue. Give reasons. Also find profit at this output.
Output
(Units)
Total Revenue
(₹)
Total Cost
(₹)
1 7 8
2 14 15
3 21 21
4 28 28
5 35 36
  1. Explain briefly the situation of excess demand in a perfectly competitive market. Use diagram.
  2. Explain briefly the situation of excess supply in a perfectly competitive market. Use diagram.
Explain the causes of a rightward shift in demand curve of a commodity of an individual consumer.
If at a given price of the commodity there is excess demand, how will the equilibrium price be reached? Explain with the help of a diagram.
OR
If equilibrium price of a good is greater than its market price, explain all the changes that will take place in the market. Use diagram.

OR
Explain the changes that will take place in the market for a commodity if the prevailing market price is less than the equilibrium price.

OR
Explain the chain of effect of excess demand of a good on its equilibrium price.
An economy produces two goods, i.e. Barley and Jowar and the following table summarises its production possibilities. Calculate the Marginal Opportunity Cost of Barley at various combinations.
Barley
100
80
55
25
10
0
Jower
0
25
50
75
85
87