Question
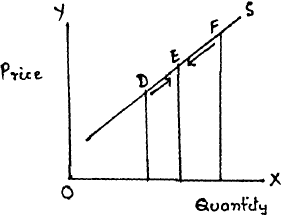
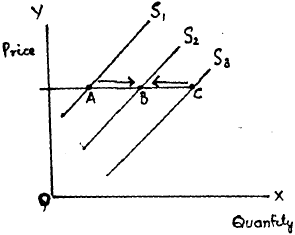
Explain the distinction between "change in quantity supplied" and "change in supply". Use diagram.

Answer


Change in Quantity supplied' refers to change in supply due to own price of the good only. It means movement along the same supply curve. It is called extension when supply rises (from D to E) and contraction when supply fall (from F to E).
Change in supply' refers to change in supply due to factor other than the own price of the good like change in prices of inputs etc. This leads to shift of supply curve, It is called 'increase' when supply rises (from A to B) and 'decrease' when supply falls (from C to B).

Need a full question paper?

Generate a complete, print-ready paper with questions like this in minutes — across 16+ boards, with answer keys.

Start Generating Free

Similar questions

Why do central problems of an economy arise? Explain the central problem of "for whom to produce"?
State three causes each for a rightward shift and a leftward shift of demand curve.
From the following data find out the level of output that will give the producer maximum profit (use marginal cost and marginal revenue approach). Give reasons for your answer.
Output (units) 1 2 3 4 5
Total Cost 9 17 24 29 36
Total Revenue 11 20 27 32 35
A consumer consumes only two goods. Why is the consumer said to be in equilibrium when he buys only that combination of the two goods which lies at that point on the indifference curve where the budget line is tangent to the indifference curve? Explain. Use diagram.OR
Using indifference curve analysis, explain the concept of consumer's equilibrium.
Explain any three causes of increase in supply of a commodity.
A farmer takes a farm on rent and carries on farming with the help of his family members. Identify explicit and implicit costs from this information. Explain.
Under what condition increase in demand would not make any effect on equilibrium quantity?
Explain the features of monopoly market.
Assuming that no resource is equally efficient in production of all goods, name the curve which shows production potential of the economy. Explain, giving reasons, its properties.
A consumer spends ₹ $80$ on a commodity when price is ₹ $1$ per unit. If the price increases by ₹ $1$, what would be his expenditure. $PED = -0.4?$