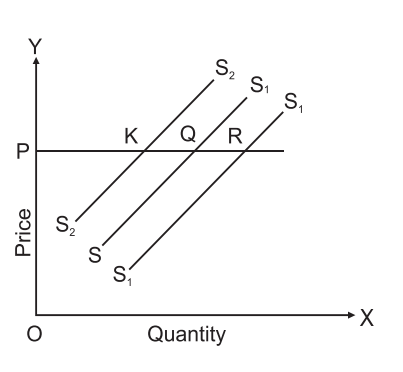
The diagram relates to the concept of change in supply.
→ SS curve is the original supply curve.
→ When supply increases, the supply curve shifts to the right.
It is denoted by S1S1 curve. At OP price, supply increases from PQ to PR.
→ Supply curve S2S2 indicates the situation of decrease in supply. The producer is now willing to supply less quantity i.e., PK at the same price.