Question
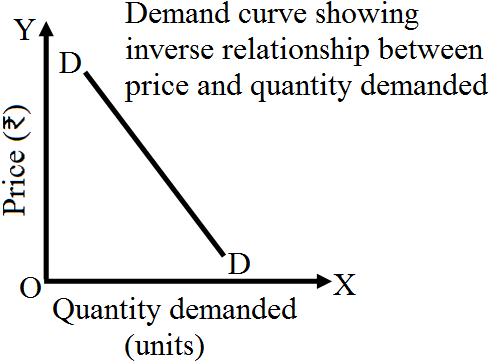
Explain the inverse relationship between price and quantity demanded of a commodity.OR
Why is the demand curve of the commodity negatively sloped?

Answer

Downward slope of demand curve indicates that more is purchased in response to fall in price and vice-versa. Thus, there is inverse relationship between own price of a commodity and its quantity demanded.This is attributed to the following factors:
  1. Law of Diminishing Marginal Utility: According to this law, as the consumption of a commodity increases, the utility from each successive unit goes on diminishing. Accordingly, for every additional unit to be purchased, the consumer is willing to pay less price.
  2. Income Effect: Change in the own price of a commodity causes a change in real income of the consumer. With a fall in price, real income increases. Accordingly, demand for the commodity expands and vice-versa.
  3. Substitution Effect: It refers to the substitution of one commodity for the other when it becomes relatively cheaper due to change in relative prices.
  4. Size of Consumer Group: When price of a commodity falls, it attracts new buyers who can now afford to buy it, hence quantity demanded rises.
  5. Different Uses: Many goods have alternative uses, e.g. milk is used for making curd, cheese and butter. If price of milk reduces, it will be put to different uses. Accordingly, demand for milk expands.

Need a full question paper?

Generate a complete, print-ready paper with questions like this in minutes — across 16+ boards, with answer keys.

Start Generating Free

Similar questions

The price elasticity of demand of good X is half the price elasticity of demand of Good Y. A 25% rise in the price of good Y reduces its demand from 400 units to 300 units. Calculate percentage rise in demand of good X when its price falls from ₹ 10 to ₹ 8 per unit.
State and discuss four characteristics of perfect competition.
Given below is the cost schedule of a product produced by a firm. The market price per unit of the product at all levels of output is Rs. 12. Using marginal cost and marginal revenue approach, find out the level of equilibrium output. Give reasons for your answer:
Output (Units)
1
2
3
4
5
6
Average Cost (Rs.)
12
11
10
10
10.4
11
Explain the conditions of consumer's equilibrium under utility analysis.
OR
Explain the conditions of consumer's equilibrium using marginal utility analysis.

OR
A consumer consumes only two goods $X$ and $Y.$ Explain the conditions of consumer's equilibrium using utility analysis.
Explain the implications of the following:
  1. Freedom of entry and exit of firms under perfect competition.
  2. Non-price competition under oligopoly.
Compute mode from the following data.
ScoreFrequency
0-1010
10-2020
20-3018
30-4032
40-5021
How does technological progress affect the supply curve of a firm?
Complete the following table.
Price (₹) 1 2 3 4 5 6 7
Units Sold 100 90 80 70 60 50 40
Given the production possibilities curve for rifles and automobiles:
  1. Suppose improvement occurs in the technology of producing rifles and not in the production of automobiles. Draw the new PPC.
  2. Now, assume that a technological advance occurs in producing automobiles and not in producing rifles. Draw the new PPC.
  3. Finally, draw a PPC which reflects technological improvements in the production of both products.
Explain any three causes of increase in supply of a commodity.