Question
Explain the law of supply with a diagram.
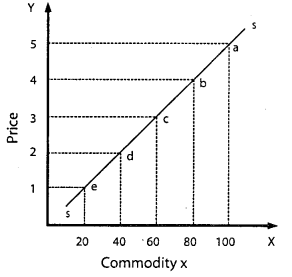
As the price of the commodity increases, the quantum supplied of the commodity also increases. Thus the supply curve has a positive slope. The points such as e, d, c, b, and a on the supply curve SS, represent various quantities of different prices.
Generate a complete, print-ready paper with questions like this in minutes — across 16+ boards, with answer keys.