Question
Explain the production possibility curve with a diagram.
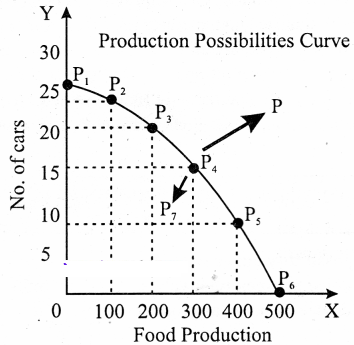
| Production Possibilities | Quantity of food production in tons | No. of car produced |
| I | 0 | 25 |
| II | 100 | 23 |
| III | 200 | 20 |
| IV | 300 | 15 |
| V | 400 | 8 |
| VI | 500 | 0 |
Generate a complete, print-ready paper with questions like this in minutes — across 16+ boards, with answer keys.