Question
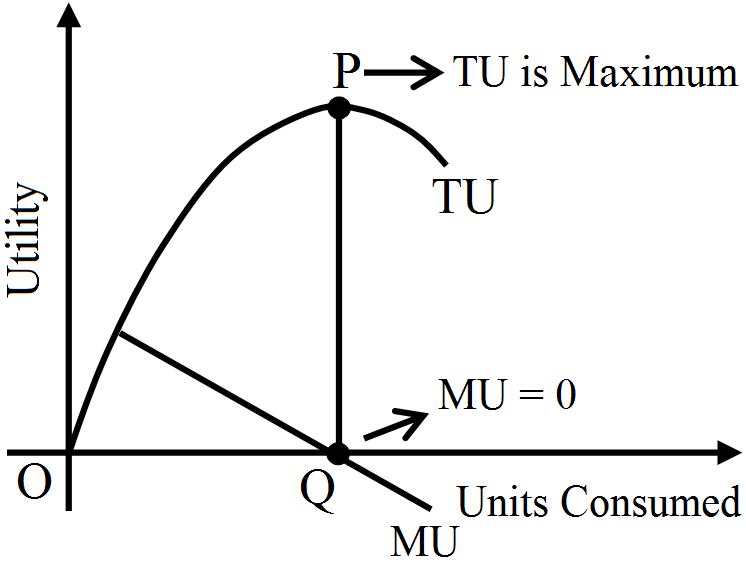
Explain with diagram, the relationship between TU and MU.
Generate a complete, print-ready paper with questions like this in minutes — across 16+ boards, with answer keys.
Units of labour | TP | $\text{MP}_\text{L}$ | $\text{AP}_\text{L}$ |
1. | 20 | - | - |
2. | - | 22 | - |
3. | - | - | 22 |
| p | d1 | d2 |
| 1 2 3 4 5 6 | 9 8 7 6 5 4 | 24 20 18 16 14 12 |