Question
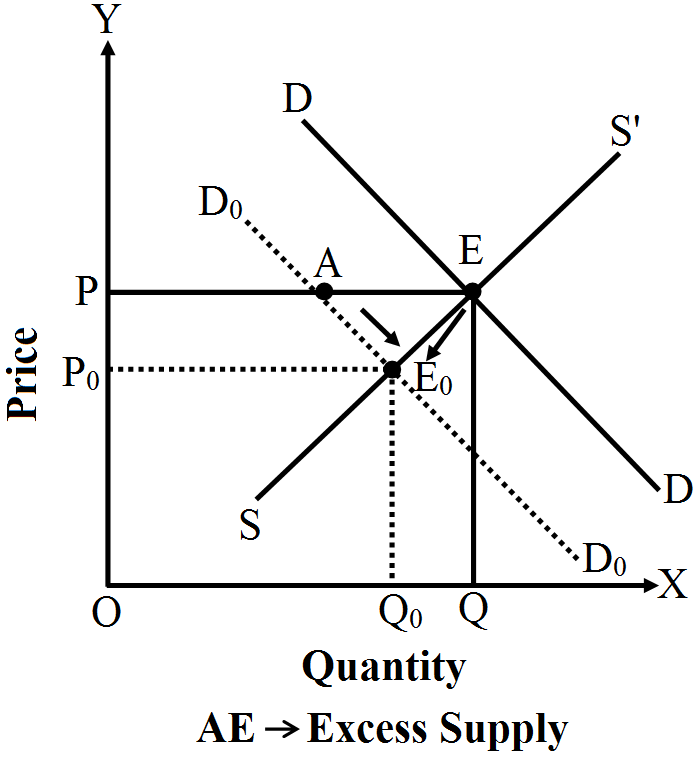
Explain with the help of a diagram the effect of a decrease in demand for a commodity on its equilibrium price and quantity
OR
Explain the chain of effects on demand, supply and price of a commodity caused by a leftward shift of its demand curve. Use diagram.

Answer


In the given diagram, $DD'$ shows the demand curve and $SS'$ shows the supply curve of a commodity. Point E denotes the point of equilibrium where $DD' = SS'$. $OP$ is the given equilibrium price and $OQ$ is the given equilibrium quantity. A decrease in demand leads to leftward shift of the demand curve. It is denoted by $D_0D_0$ curve. Now, at given price $OP$, new quantity demanded is $OQ_0$ which is less than supply by $QQ_0$. The excess supply equal to AE emerges.
This excess supply results in competition among the sellers leading to a fall in price. A fall in price results in rise in quantity demanded (a downward movement along the new demand curve) and a fall in quantity supplied (a downward movement along the supply curve) shown by arrows in the diagram. These changes continue till we reach price $OP_0$. This is new equilibrium price at which quantity demanded and supplied are equal at $OQ$. Hence equilibrium price falls from $OP$ to $OP_0$ and equilibrium quantity also falls from $OQ$ to $OQ_0$.

Need a full question paper?

Generate a complete, print-ready paper with questions like this in minutes — across 16+ boards, with answer keys.

Start Generating Free

Similar questions

Compute the total revenue, marginal revenue and average revenue schedules in the following table. Market price of each unit of the good is Rs. $10$.
Quantity Sold
TR
MR
AR
0
1
2
3
4
5
6


Explain with the help of diagrams, the effect of the following changes on the demand of a commodity:
  1. A fall in price of Substitute good.
  2. A fall in price of Complementary good.
The demand function of a commodity x is $Q_x = 12 - P.$ (where $Q_x =$ the quantity demanded of a commodity x and $P_x =$ price of the commodity x). Derive the TR and MR schedules when the price of commodity varies from ₹ 12 to ₹ 1.
Explain the 'free entry and exit of firms' feature of monopolistic competition.
A $5\%$ fall in price of a good leads to $10\%$ rise in its demand. A consumer buys $40$ units of a good at a price of ₹ $10$ per unit. How many units will he buy at a price of ₹ $12$ per unit?
There are three identical firms in a market. The following table shows the supply schedule of firm 1. Compute the market supply schedule.
Price (Rs)
$SS_1$ (units)
0
1
2
3
4
5
6
7
8
0
0
2
4
6
8
10
12
14
Explain the effect of increase in income of buyers of normal commodity on its equilibrium price.
When the price of a commodity rises from Rs. 10 to Rs. 11 per unit, its quantity supplied rises by 100 units. Its price elasticity of supply is 2. Calculate its quantity supplied at the increased price.
Calculate Total Variable Cost and Marginal Cost from the following cost schedule of a firm whose Total Fixed Costs are Rs.12:
Output

(Units)
Total Cost

(Rs.)
1 20
2 26
3 31
4 38
When the price of a commodity falls from 10 per unit to 9 per unit, its quantity supplied falls by 20 percent.