MCQ
Figure show the graph of the polynomial $f(x)=a x^2+b x+c$ for which
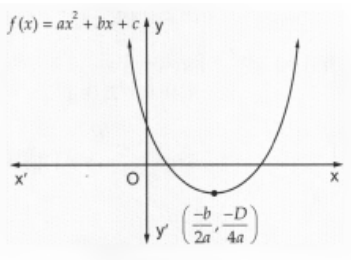
Image
  • a > 0, b < 0 and c > 0
  • B
    a < 0, b < 0 and c < 0
  • C
    a < 0, b > 0 and c > 0
  • D
    a > 0, b > 0 and c < 0

Answer

Correct option: A.
a > 0, b < 0 and c > 0
(a) a $>0$, b $<0$ and c $>0$
Explanation: Clearly, $f(x)=a x^2+b x+c$ represent a parabola opening upwards.
Therefore, $a>0$
The vertex of the parabola is in the fourth quadrant, therefore $b <0$
$y=a x^2+b x+c$ cuts Y axis at P which lies on OY .
Putting $x =0$ in $y=a x^2+b x+c$, we get $y = c$.
So the coordinates of P is $(0, c )$.
Clearly, P lies on OY.$\Rightarrow c >0$
Hence, $a>0, b<0$ and $c>0$

Need a full question paper?

Generate a complete, print-ready paper with questions like this in minutes — across 16+ boards, with answer keys.

Start Generating Free