Question
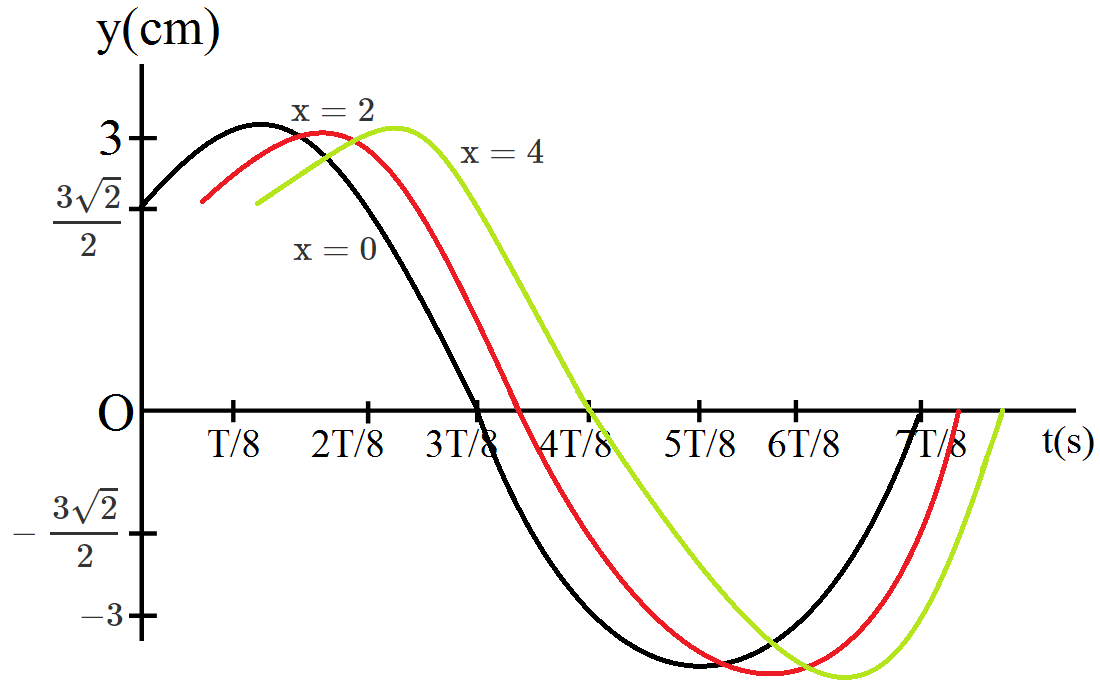
For the wave described in Exercise 15.8, plot the displacement (y) versus (t) graphs for x = 0, 2 and 4cm. What are the shapes of these graphs? In which aspects does the oscillatory motion in travelling wave differ from one point to another: amplitude, frequency or phase?

Answer

All the waves have different phases.

The given transverse harmonic wave is:

$\text{y}(\text{x, t})=3.0\sin\Big(36\text{t}+0.018\text{x}+\frac{\pi}{4}\Big)\ \dots(\text{i})$

For x = 0, the equation reduces to:

$\text{y}(\text{x, t})3.0\sin\Big(36\text{t}+\frac{\pi}{4}\Big)$

Also,

$\omega=\frac{2\pi}{\text{t}}=36\text{ rad/s}^{-1}$

$\therefore\ \text{t}=\frac{\pi}{18}\text{s}$

Now, plotting y vs. t graphs using the different values of t, as listed in the given table

t (s)

0

T/8

2T/7

3T/8

4T/8

5T/8

6T/8

7T/8

y (cm)

$\frac{3}{\sqrt{2}}$

3

$\frac{3}{\sqrt{2}}$

0

$-\frac{3}{\sqrt{2}}$

–3

$-\frac{3}{\sqrt{2}}$

0

Need a full question paper?

Generate a complete, print-ready paper with questions like this in minutes — across 16+ boards, with answer keys.

Start Generating Free

Similar questions

Prove that the center of mass of a cone of height $h$ is located at $\left(\frac{h}{4}\right)$ height from its base.
A and B are two identical balls. A moving with a speed of 6ms-1 along the positive x-axis, undergoes a collision with B, intially at rest. After collision each ball moves and the directions making of