Ecological Pyramids : The structure of ecosystems can be visualized with ecological pyramids, which were first described by the pioneering studies of Charles Elton in the 1920s. Ecological pyramids show the relative amounts of various parameters (such as number of organisms, energy and biomass) across trophic levels. It has numerous names like Eltonian pyramid after Charles Elton, energy pyramid, trophic pyramid, and food pyramid. Ecological Pyramid is a graphical depiction which is meant to illustrate the relationship between different living organisms at different level in an ecosystem. In an ecosystem there are three types of ecological pyramid. The pyramid consists of a number of horizontal bars showing specific trophic levels which are arranged sequentially from primary producer level through herbivores, carnivores onwards. The length of each bar represents the total no. of individuals at each trophic level in an ecosystem. The number, biomass and energy of organism gradually decrease with each step from the producer level to consumer level and the diagrammatic representation takes a pyramid shape.
Types of Ecological Pyramid : The ecological pyramids are of three types :
1. Pyramid of numbers
2. Pyramid of Biomass
3. Pyramid of Energy
1. Pyramid of Numbers : Pyramid of numbers represent the total numbers of individuals (population) present in each trophic level. This deals with the relationship between the numbers of primary producers and consumers of different levels. This pyramids quite convenient especially when it comes to counting the number of organisms. Counting is a simple task and it can be done over the years to determine the changes in a specific ecosystem. It is a graphic representation of the total no. of individuals of different species belonging to each trophic level in an ecosystem.
Pyramid of number is divided into two different forms depending on the number of organisms :
(i) Upright Pyramid of number
(ii) Inverted Pyramid of number
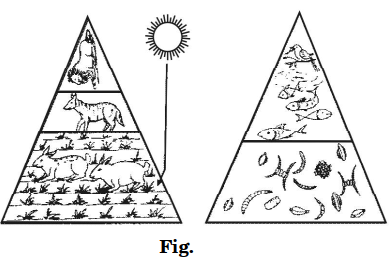
Upright Pyramid of Number : In the Upright pyramid of numbers, the numbers of organisms mostly reduce from bottom to top. It usually occurs in pond and grassland ecosystems where plants occupy the base of the pyramid. The next levels of the pyramid include the consumers.
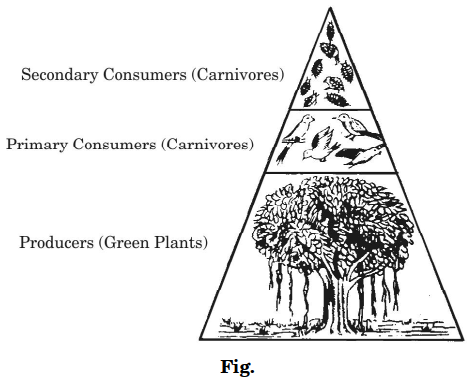
Inverted Pyramid of Number : An inverted pyramid is actually the opposite of the upright pyramid. It can closely be observed in tree ecosystem, where trees are the producers and insects are the consumers.
2. Pyramid of Biomass : This pyramid indicates the total mass of organisms in a particular trophic level. A pyramid of numbers shows the relationship between the amount of food available and how much energy is being passed at each trophic. Biomass-consumed by animals mostly is either converted to living tissue, converted to energy or remain as undigested products.
The pyramid is usually larger at the bottom but as it goes up it reduces in size and becomes smaller. There is always a reduction of biomass with an increase in trophic level. Approximately 10% to 20% of the biomass is passed from one trophic level to the other.
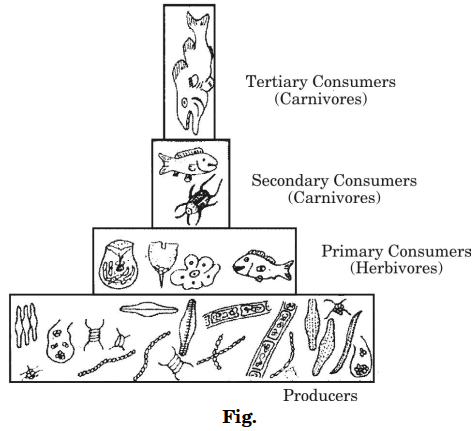
3. Pyramid of Energy : An energy pyramid represents the amount of energy at each trophic level and loss of energy at each transfer to another trophic level. Pyramid of energy is an upright pyramid that illustrates the flow of energy from producers to consumers. Furthermore, it indicates the actual role played by various organisms in energy transfer. Energy pyramid indicate how much energy is required in the next trophic level as it flows upwards. Hence the pyramid is always upright, with a large energy base at the bottom. To compare the functional role of the tropic levels in an ecosystem, the energy pyramid is more suitable. It reflects the laws of thermodynamics, with conversion of solar energy to chemical energy and heat energy at each trophic level and with the loss of energy being depicted at eaach transfer to each trophic level.