MCQ
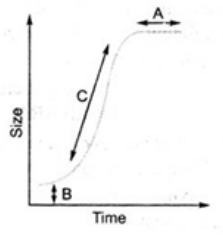
Given below is a graph drawn on the parameters of growth versus time. $A, B$ and $C$ respectively represent
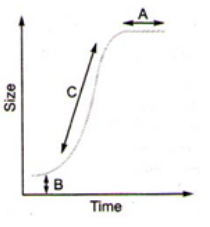
  • A
    Exponential phase, log phase and steady state phase
  • Steady state phase, lag phase and log phase
  • C
    Slow growing phase/lag phase, log phase and steady state phase
  • D
    Lag phase, steady state phase and log phase

Answer

Correct option: B.
Steady state phase, lag phase and log phase
b
It is the graphic representation of growth against time. If total growth is plotted against time, an S-shaped or sigmoid curve is obtained. Where, $A$ is the steady state phase. $B$ is the lag phase and $C$ is the log phase.

Need a full question paper?

Generate a complete, print-ready paper with questions like this in minutes — across 16+ boards, with answer keys.

Start Generating Free